
ARPU and LTV are often used interchangeably. But in reality, they are two fundamentally different metrics. They are calculated in different ways. They answer different questions.
This article will discuss the following:
- How to calculate ARPU
- How ARPU differs from LTV
- How increasing ARPU can harm your business
- How decreasing ARPU can benefit your business
- Why you need to be careful about using ARPU to make product decisions
→ Test your product management and data skills with this free Growth Skills Assessment Test.
→ Learn data-driven product management in Simulator by GoPractice.
→ Learn growth and realize the maximum potential of your product in Product Growth Simulator.
ARPU Formula (Average Revenue per User)
To calculate ARPU (Average Revenue per User) for a certain period, divide the revenue of the product by the number of active users in that period.

ARPU can be calculated for different periods of time: by days, weeks, months, and quarters. Some variations of ARPU have specific names.
For example, the ratio of daily revenue to daily active audience is called ARPDAU (Average Revenue per Daily Active User). ARPWAU and ARPMAU metrics work similarly but for weeks and months, respectively.
How to calculate ARPPU (Average Revenue per Paying User)
Another metric related to ARPU is ARPPU (Average Revenue per Paying User).
When calculating ARPPU, we divided the revenue by the number of paying users (instead of active users as in ARPU). This metric allows us to understand how much revenue the average paying user brings.

Example of calculating ARPU and ARPPU
Example of calculating ARPU and ARPPU
- You are working on a mobile game
- Last month the game had 10,000 active users
- 1,000 of them made purchases
- They brought in $34,000 in revenue
- ARPU per month = 34,000 / 10,000 = $3.4
- ARPPU per month = 34,000 / 1,000 = $34
What questions do ARPU and ARPPU metrics answer?
The ARPU metric tells us how much revenue an average active user brings over a certain period of time.
In the game example above, the average active user brings in $3.4 per month.
The ARPPU metric tells us how much revenue an average paying user brings over a certain period of time.
In the game example above, the average paying user brings in $34 per month.
How ARPU differs from LTV
ARPU differs from LTV in almost every aspect:
- Based on what the metric is calculated
- How exactly it is calculated
- Which question it answers
Difference between how ARPU and LTV metrics are calculated:
- ARPU is calculated based on Revenue (Income).
- LTV is calculated based on Contribution Margin (revenue minus variable costs).
How ARPU and LTV metrics are calculated:
- To calculate ARPU, we divide the revenue over a period of time by the number of active users.
- To calculate LTV, we divide the contribution margin over the lifetime of a cohort of users in a product by the number of users in that cohort. Find more details here.
What questions do ARPU and LTV answer:
- ARPU tells us how much revenue an average active user brings over a certain period of time (e.g., a month).
- LTV tells us how much contribution margin (revenue minus variable costs or simply profit) an average new user will bring over the lifetime of using our product. Sometimes, LTV is considered at a certain point after the user joins the product. In such cases, it will not correspond to the user’s entire lifetime in the product but for the corresponding period.
| Metric | ARPU | LTV |
| Calculated based on | Revenue | Contribution Margin (Revenue minus variable costs) |
| How to calculate | Revenue / Active users | Contribution Margin over Lifetime / New users |
| What questions answers | Revenue from 1 user for a certain period | Contribution Margin from a new user for her entire lifetime in the product |
Differences between ARPU and LTV on Facebook
ARPU for Facebook
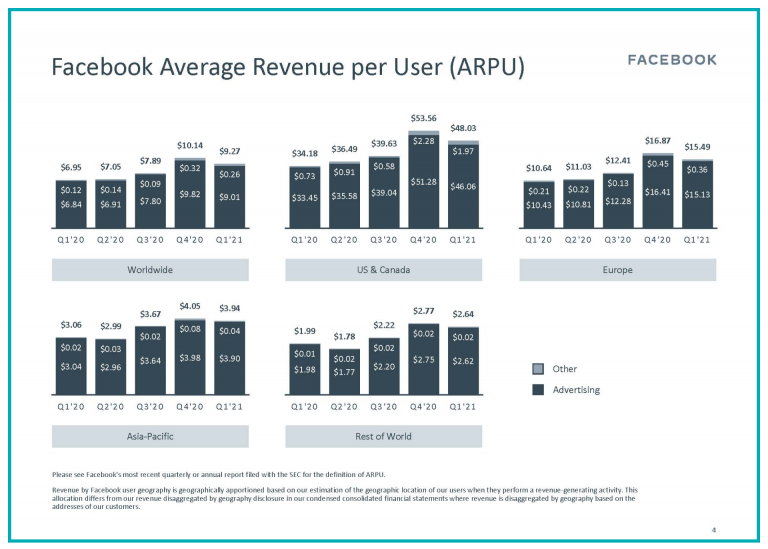
The picture below is from Facebook’s quarterly report for its main product (the social network Facebook excluding Instagram and WhatsApp).
In Facebook’s report, ARPU is not calculated in a standard way. They divide the quarter’s income by the average MAU to calculate ARPU. But given Facebook’s Retention, we can assume that the average MAU for the quarter is not much different from the total active users for the quarter.
We define ARPU as our total revenue in a given geography during a given quarter, divided by the average of the number of MAUs in the geography at the beginning and end of the quarter. While ARPU includes all sources of revenue, the number of MAUs used in this calculation only includes users of Facebook and Messenger as described in the definition of MAU above. Revenue from users who are not also Facebook or Messenger MAUs was not material.
Thus, Facebook earns on average about $9-10 per active user per quarter. In the US this figure reaches $48-54, in Europe $15-17, and in the rest of the world about $2-3.
Facebook’s LTV
ARPU metrics provide insight into how Facebook is monetizing its active user base. It compares user purchasing power and aggressiveness of monetization across countries. But ARPU says nothing about how much Facebook gets from the average new user over their lifetime in the product.
Let’s try to estimate Facebook’s LTV. It is worth mentioning that most people in the world continue to use Facebook regularly and do not plan to leave it yet, which makes it difficult to calculate the contribution margin or profit of an average user over their entire lifetime. But we can try to calculate how much profit the average Facebook user has generated for the company by the time spent in the product so far. To do this, we will need to estimate the number of new users and the profit (revenue minus variable costs) of the Facebook product over its entire existence.
For an estimate of the number of new Facebook users over time, you can take the world’s population with Internet access outside of China. This will give you approximately 3.5 billion new users.
Between 2009 and 2020, Facebook’s core product grossed approximately $330 billion. If you subtract the variable costs, you get about $275 billion.
It turns out that the average new user has brought Facebook about $80 until now. This is the lower bound for LTV as most users continue to use the product regularly, and many of them came to Facebook not too long ago. But even this figure looks impressive for such a massive product.
Thus, the quarterly ARPU of Facebook is approximately $9-10 (this is how much revenue the average active user brings in). And the lower LTV estimate is $80 (at least that much contribution margin or profit is brought by a new user of the company).
ARPU and LTV are different metrics that are calculated differently and answer different questions.
The scope of ARPU’s applicability, or how increasing ARPU can hurt your business
ARPU answers a clear question and has a transparent and practical meaning. It is suited for understanding how you monetize your active audience, what happens to monetization over long periods of time, and how the purchasing power of different user segments differs.
ARPU metric is suitable for analyzing established products with a large and stable active audience. This is why ARPU works well for Facebook when analyzing monetization trends by geography. It is also why mobile carriers love this metric so much.
But when doing product analytics and assessing the impact of changes on user behavior, the ARPU metric must be used with great caution. You can increase ARPU in the short term but also hurt your business. Conversely, you can reduce your ARPU while still improving your business. Let’s look at a few examples.
Example 1
For most products, if you stop attracting new users, you’ll see an increase in ARPU. In older cohorts, there is usually a higher proportion of relevant paying users in the active audience. Therefore, when you stop acquiring new users, the older cohorts will represent a higher proportion of your active audience, which will lead to a growth in ARPU. But shutting down the influx of new users is obviously a bad decision for your business.
Example 2
The marketing team found a new distribution channel with ROI > 0. But users from this channel have lower LTV than users from other channels. By using this channel, the ARPU will decrease, but the overall business will improve.
The reason for this behavior of ARPU is that when calculating the metric, the denominator is the number of active users for the studied period. And active users are a very unstable and constantly changing entity. For example, for new products, the active audience consists primarily of new users, while for old products, it is composed of people who have used the product for months or years. Therefore, metrics calculated based on active audience strongly depend on the audience’s composition.
Therefore, I do not recommend evaluating the impact of product changes on monetization using ARPU. Instead, use LTV, conversion to purchase, and other metrics calculated using cohort analysis.
Summary
ARPU and LTV metrics are fundamentally different: they are calculated based on different values, in different ways and—as a result—answer different questions.
ARPU is suitable for comparing monetization efficiency and tracking changes over long periods of time. But it is not suited for analyzing specific changes to a product. For these purposes, it is better to use LTV, conversion to purchase, and other metrics calculated using cohort analysis.
Practice now
Test your skills with this quick quiz