
Here are two things you’ll hear a lot from product teams:
1. A lot of data is needed to reduce uncertainty and get an accurate picture of users’ needs and behavior.
2. People working on products understand and know their users well.
The above statements are misconceptions, and in both cases, the reverse is true. In this post, I will discuss how analyzing user behavior without big data (debunking the first premise) will help us avoid the unpleasant outcomes of thinking you already know your users (debunking the second premise).
→ Test your product management and data skills with this free Growth Skills Assessment Test.
→ Learn data-driven product management in Simulator by GoPractice.
→ Learn growth and realize the maximum potential of your product in Product Growth Simulator.
→ Learn to apply generative AI to create products and automate processes in Generative AI for Product Managers – Mini Simulator.
→ Learn AI/ML through practice by completing four projects around the most common AI problems in AI/ML Simulator for Product Managers.

First misconception: We need a lot of data to reduce total uncertainty
Imagine an infinite sized pool of black and white balls. Your task is to find out the share of white balls. Initially, you are in a state of complete uncertainty. How much data do you need to find the answer to this question?
If you take 100 random balls and calculate the proportion of white balls, then you will know the answer with an accuracy of ± 9.8%. If you add another 100 balls, you will increase the accuracy of your answer to ± 6.9%; Add 200 more balls—you are up to ± 4.9%. Another 600 balls—up to ± 3.1%. With 9,000 more balls, you will achieve ± 1% accuracy.
Did you notice that the first 100 balls gave us a lot more knowledge than the next 100, and going from 100 to 200 balls had much more impact on the accuracy than the 1,000-10,000 range?
Let’s keep this in mind and move on to the second misconception.
Second misconception: People working on products understand and know their users well
The second misconception assumes we understand the products we are working on.
The truth is, we don’t.
We are always looking for ways to close the gap between the product model we envision and the actual product we build. To do so, we try out new tools and approaches, communicate with users, conduct experiments and analyze data.
The goal behind all of these activities is simple. We want to improve our understanding of the product and users, to find opportunities for growth and development, and to increase the proportion of the right decisions we make.
Viewing the product through users’ eyes
What was this long introduction about? I want to introduce you to a method that will allow you to learn a lot about your product. It is very simple:
Take a few users and observe how they use your product.
No, you don’t have to conduct an interview with these users. There’s also no need to calculate the metrics that characterize their behavior in the product. We literally need to take a specific user and monitor how she interacts with the product throughout her entire period of usage.
How can you do it? If you already have event logging set right in the product, it is very simple:
- Select the group of users you want to study (you will need different users to get answers to different questions).
- For each user of this group, create a sequence of all the events they generate, including the event parameters, from the time they start using the product.
- You will end up with a sequence of events for each user in your product. You can divide this sequence into separate sessions for convenience.
You can also do it with the help of Amplitude’s User Look-Up tool.
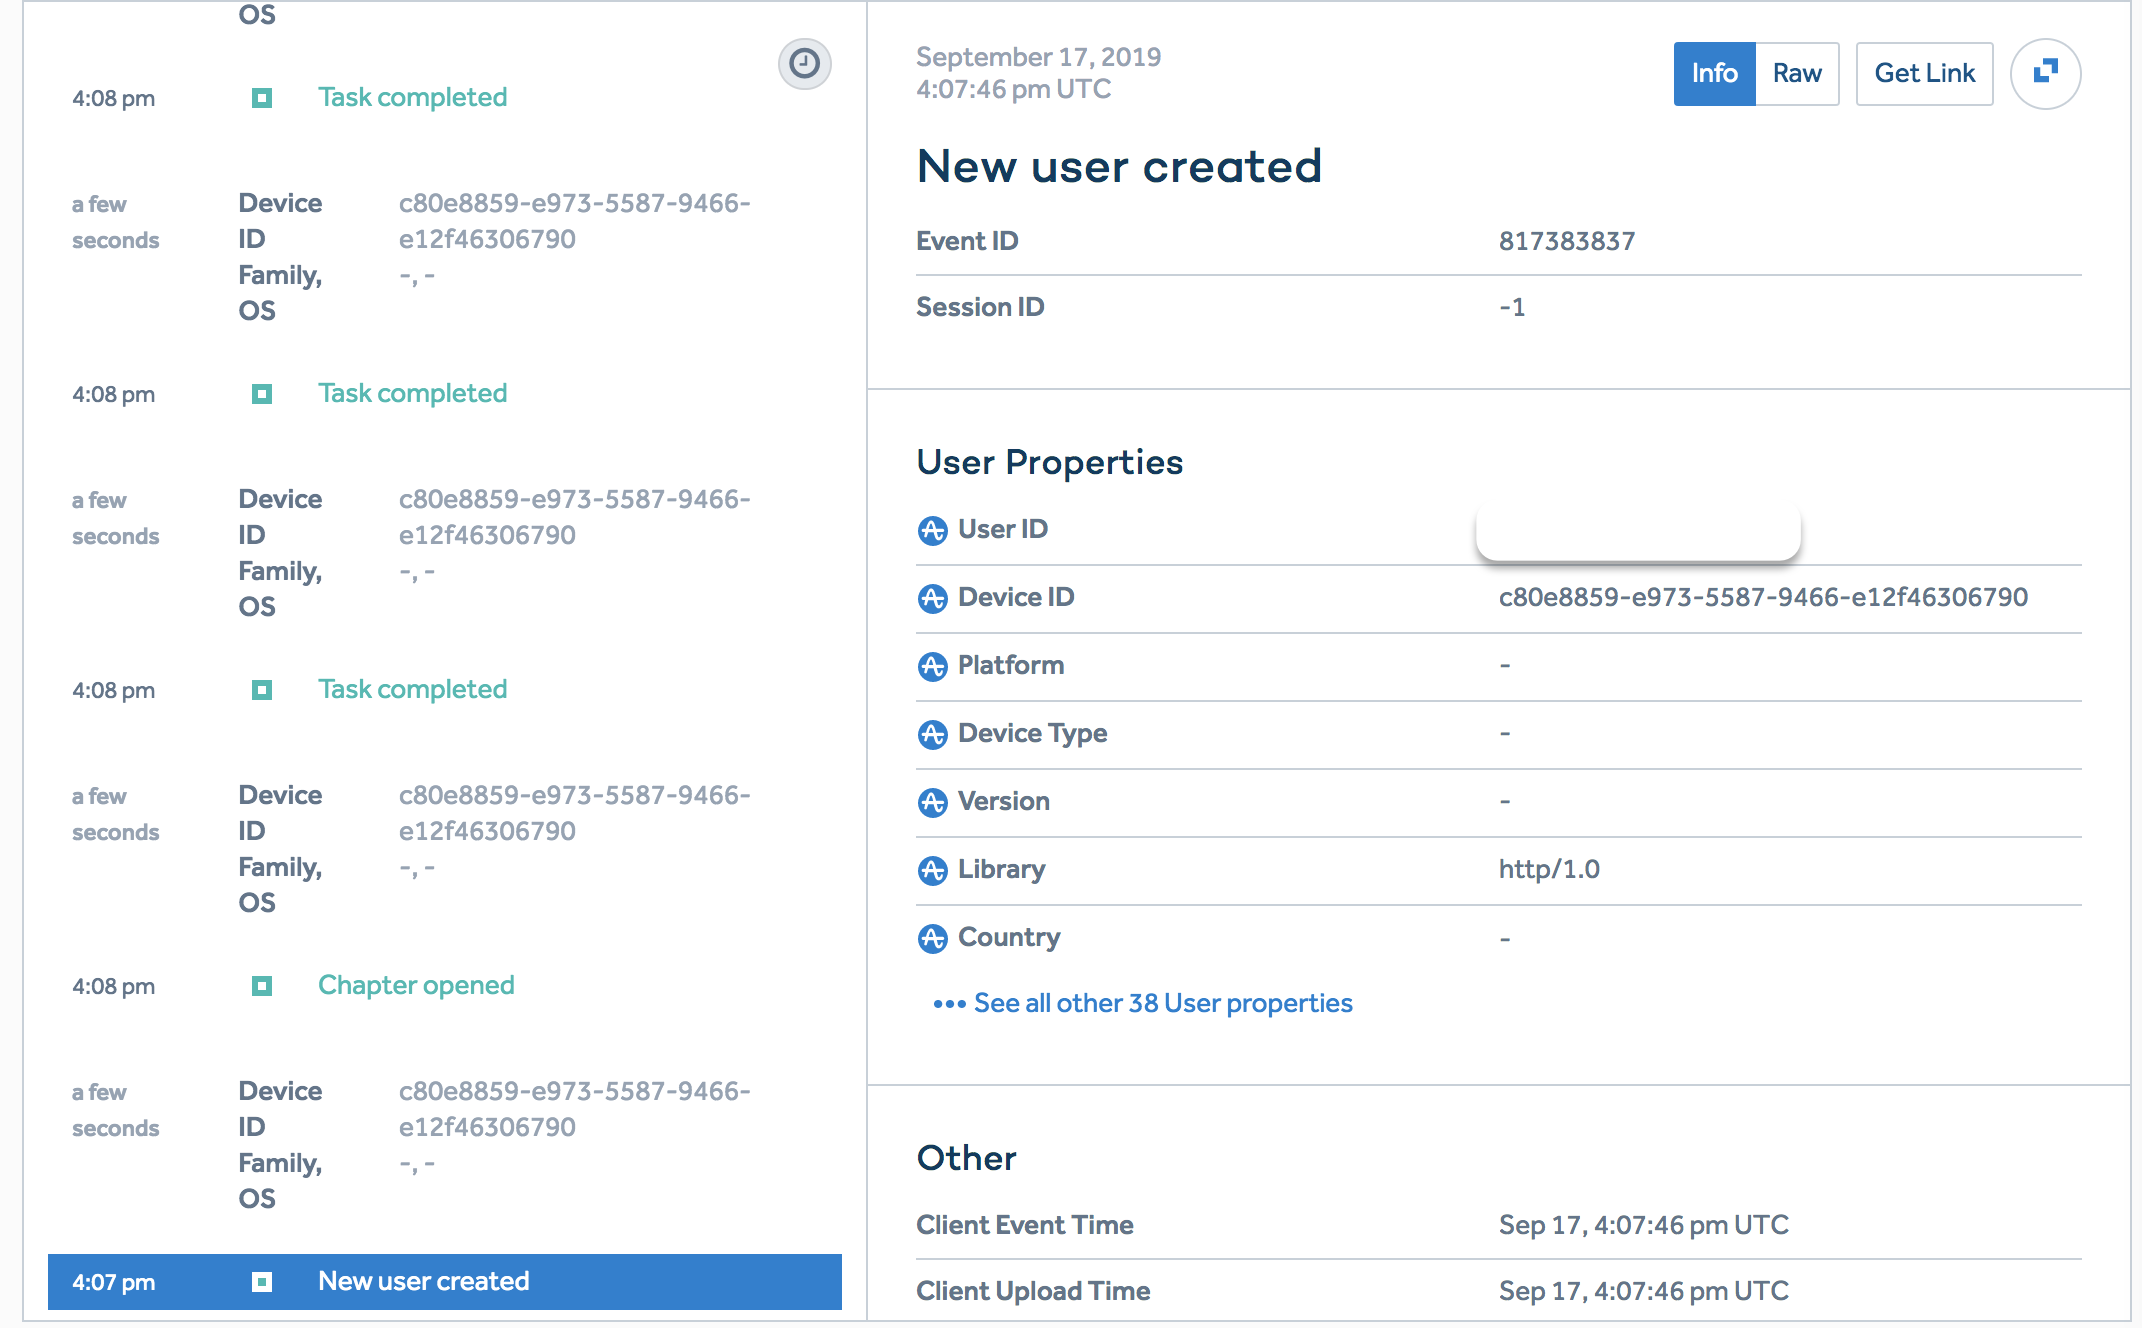
Now you have everything you need to view the product through the user’s eyes. Look at the sequence of events and start analyzing it. Take notes along the way.
You will observe what the user does while going through the onboarding and afterward, what difficulties she encounters along the way, at what point her first session ends, whether she has experienced the product’s value by that time, when does she retain and how long it takes her to do so, and much more.
Now, let’s go back to the first misconception. Studying a small number of users (50-100) with this method will help you find out the following:
- How and why do people use your product?
- What problems do they face at different stages in your product?
- How does the actual usage differ from what you designed the product for
- Which users tend to stay and which tend to leave? What are the differences between them?
Another benefit of doing this type of analysis is that it helps you come up with a bunch of hypotheses that you can test/validate through data analysis, experiments or user research.
Case studies of analyzing user behavior through session analysis
The method we described above solves a wide range of tasks, so it can be considered quite universal. Here are a few cases where session analysis proved to be very useful.
Yandex Maps Redesign
Redesigning any old popular service is extremely risky. It’s very important not to break any of the existing use cases in the new design.
A few years ago, I worked on the redesign of the web version of Yandex Maps, the most popular online map service in Russia and CIS market with over 30 million users. Due to the complexity and scale of the task, we wanted to make sure we understood thoroughly all the use cases our users have. To do that we decided to manually analyze user sessions.
We selected a few hundred random users, manually examined their sessions, categorized them, and wrote down our observations. The result was a table of existing product use cases and their popularity.
You might argue that this approach was not necessary, that we could have just calculated the share of people who used the product to build routes, those who checked the traffic jams, or searched for organizations, etc. But these quantitative indicators would have hidden a lot of useful and critical information about the way people solve their problems with the product.
It turned out, for example, that different people used the same features and solved similar tasks in completely different ways. And it was something we should have considered in the new version of the product.
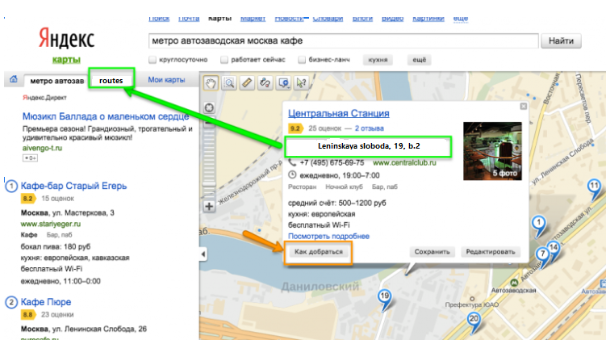
In the process, we made a number of unexpected discoveries. For example, it seemed obvious to us that in the task “to find an organization on a map -> find out how to get there,” users build a route directly from the organization’s snippet (see the orange arrow in the screenshot).
In reality, however, it turned out that only a small percent of users did this. Most users simply copied the address of the organization and pasted it in the routes tab to build a new route (see the green arrow on the screenshot).
I don’t know any other way to learn about such unexpected twists in users’ behavior other than tracking their events and examining their sessions. And the fact that such behavior exists entails many questions. Creating routes directly from the organization’s snippet is clearly easier than copy-pasting its address in the route tab. Why are users missing it? Is the organization’s featured snippet overloaded with data? Are users not noticing the button?
Finding problems in the first versions of King of Thieves
When creating products, we usually assume people are going to use them in the “correct” way. We design a product in a way that helps users discover its core value as soon as possible.
Surprisingly, “silly” users always do everything in their own way instead of the way we anticipate. This is exactly what happened with the first versions of King of Thieves.
King of Thieves is a mobile game in which you have to break into dungeons and steal treasures and gems. You can play the game in single-player mode, but the true value of the game is in its competitive multiplayer mode. The key feature of the game is to steal gems from other players to become the wealthiest thief. At the same time, players must defend their own treasures and build traps in order to stop rivals from stealing their treasures.
King of Thieves turned out to be a very successful game—but the launch of its first version was a disaster.
The game’s retention was a poor 26%. Most players left the game shortly after they tried it and never came back.
To understand the reasons behind this, we looked at the user sessions in the way described above. We wanted to understand what was wrong.
The core value of the game was in its multiplayer mode. When creating the game’s onboarding, we assumed that we would show how the game mechanics work in the first levels of the single-player campaign, and then players would switch to the multiplayer mode when they were ready. That’s exactly why we made a huge red multiplayer button after all!
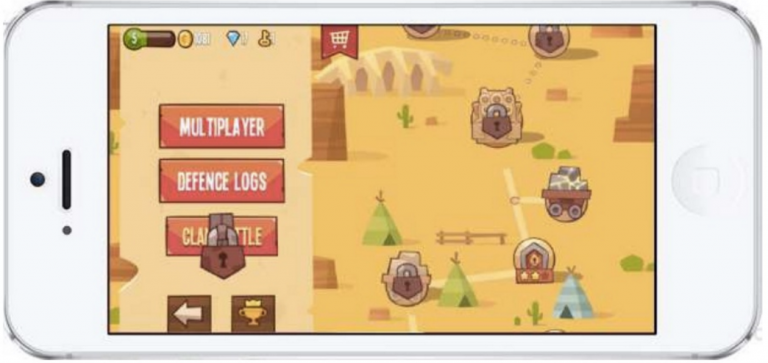
But it turned out that most users simply went through the single-player levels without ever paying attention to the multiplayer game mode. After some time, they got stuck in a difficult level, or just got bored, and abandoned the game.
There were few who switched to multiplayer, but in most cases the players saw no difference from the single-player mode. The opponent either had no gems to steal, or he did, but when players completed the level, they weren’t awarded the gem, even though stealing gems from other players was part of the game’s core loop.
After analyzing the sessions of several hundred users (the sessions were very short, so it didn’t take us too long), we figured out that less than 10% of users had a chance to experience the essence of the game in their first few sessions. Those who grasped it were much more likely to keep playing the game.
Of course, we should not forget that at that point, this was just a correlation—it did not necessarily mean that players kept playing the game because of that experience. Nonetheless, it was a good starting point, and the hypothesis that walking more users through this experience will improve the metrics was worth testing.
We could have probably found this problem through metrics alone: We would see that a very small percentage of new users try the multiplayer mode. And in most cases, those who do try do not steal gems from their opponents. But we didn’t know exactly what we were looking for or when we needed to pay our attention. Perhaps everything was fine, and players simply didn’t find the mechanics of the game entertaining enough.
We launched a new version of the game in which we walked players through the multiplayer mode in the onboarding and also made sure that when players attack a dungeon, there’s a gem for them to retrieve and they actually get it after completing the level. As a result, the game metrics significantly improved: Day 1 retention soared from 26% to 41%, while Day 7 retention increased from 9% to a healthier 20%.
While examining the sessions and looking at the product through the eyes of our users, we found the stark contradiction between what players experienced and what we wanted them to actually experience.
Optimizing the Funnel of adding a flight in App in the Air
Here is a wonderful example that Bayram Annakov shared in his blog.
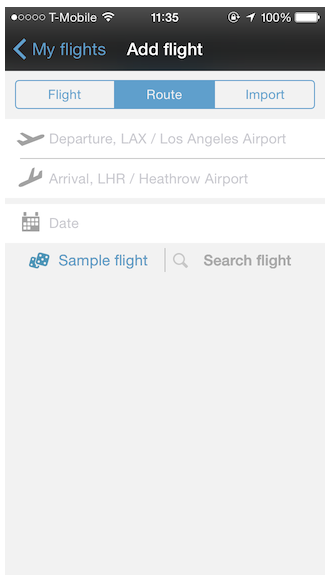
App in the Air is a mobile app that keeps track of your itineraries, boarding passes, and frequent-flier programs. The application helps ease the frustration and complexities of finding and managing flights.
However, the product team found that 30% of users of the App in the Air didn’t add a flight after opening the app screen where they were expected to do that.
The problem turned out to be pretty trivial, as has been the case in many similar problems. The users would search for the name of the airline or airport they sought in their native language—the search worked only in English.
The funnel demonstrated that 30% of users churn at a certain step, but in order to find out why, it was necessary to go one level deeper and look at what exactly people were doing at that step.
After making sure all the app’s localized languages were considered, the churn rate at this funnel step declined from 30% to 5%.
Personal sales first
Y Combinator co-founder Paul Graham has an iconic essay titled “Do things that don’t scale.” One of the things Graham mentions is that founders should personally find their first customers and help them onboard into their product, serving as a tutorial manual in a way.
Why? Because it gives the opportunity to look at your product through users’ eyes, which in turn allows you to quickly find points your users don’t understand, where they find the maximum value, and what is and isn’t important to them.
It is true that this can be labor intensive and not fun at all. It is way easier and less stressful to look at a drop in the funnel at a specific step than to seek and observe lack of understanding in real people to whom you’ve recently spoken about all the advantages of your service.
Personal sales work great for B2B products. In fact, session analysis is a variation of this approach that is more suitable for B2C products (though it can also work for B2B). Now you can select the users you need and study them in detail, like in the previous example with App in the Air, where users reached the screen where they could add a flight, but for some reason didn’t complete the step.
Moreover, you can also contact these users personally later and ask them the questions you have in mind. This will make the overall picture as complete as possible.
Pros and cons of analyzing user sessions manually
Analyzing user sessions will give you a more decent understanding of how people are using your product. This is not an abstract knowledge of how various popular features and conversion of various funnel steps work, but a vivid idea about your users’ paths within the product from the moment they start using it until they either churn or your service becomes a part of their life.
Another bonus of such an analysis is making it easier for you to work on new things in the product. Having a clear picture of the current paths of your users inside the service, you can better predict how and at what stage the planned changes will affect them. This increases your chances of making the right decision.
Unlike using metrics, this method loses much less information along the way. But, as is usually the case, it also has its disadvantages. Unfortunately, you won’t be able to compare different versions of the product based on the manual session analysis method. You will have to analyze too many of them to obtain statistically significant results. In this case, metrics, cohort analysis, and A/B tests will help you.
Summing it up
Many think that analytics is all about numbers and mathematics. In my opinion, analytics should help you to understand your product and answer questions you have about it. Numbers and metrics can help with this and solve some problems rather well, but you should not limit yourself to them. For some tasks, other approaches, including manual session analysis, will do a much better job.
Try examining the session of 50 users of your product. If you don’t find anything interesting, you’ve only lost a few hours of your time. However, and I can bet on it, you will probably find a few pleasant surprises.
→ Test your product management and data skills with this free Growth Skills Assessment Test.
→ Learn data-driven product management in Simulator by GoPractice.
→ Learn growth and realize the maximum potential of your product in Product Growth Simulator.
→ Learn to apply generative AI to create products and automate processes in Generative AI for Product Managers – Mini Simulator.
→ Learn AI/ML through practice by completing four projects around the most common AI problems in AI/ML Simulator for Product Managers.