
Retention rate is one of the fundamental metrics in product management. We all use it regularly, yet few of us know that there are many different ways to calculate retention rate. And it is very important to know which one to use when you’re making decisions based on retention data.
Let me start with a story. When I worked at Zeptolab (popular game development company, creator of Cut the Rope, King of Thieves, CATS) once we got an email from a gamedev studio that wanted us to publish their game. We were getting many similar emails, but that one got our attention. We were impressed by the metrics of the game, which had just recently soft launched. According to the developers, Day 1 retention rate of the game was over 55%, and Day 7 retention rate was over 25%.
However, when we started playing and testing the game, something felt wrong. The gameplay was not engaging enough to justify >55% Day 1 retention rate. And the meta game design was not good enough to users in the longer term.
Further investigation revealed that what this game development company called retention was actually “rolling retention.” Classic Day N retention of the game happened to be unimpressive.
This is just one example of how retention metrics can misguide you. There are many nuances in how you can calculate it.
→ Test your product management and data skills with this free Growth Skills Assessment Test.
→ Learn data-driven product management in Simulator by GoPractice.
→ Learn growth and realize the maximum potential of your product in Product Growth Simulator.
→ Learn to apply generative AI to create products and automate processes in Generative AI for Product Managers – Mini Simulator.
→ Learn AI/ML through practice by completing four projects around the most common AI problems in AI/ML Simulator for Product Managers.
Classic Day N retention vs rolling retention
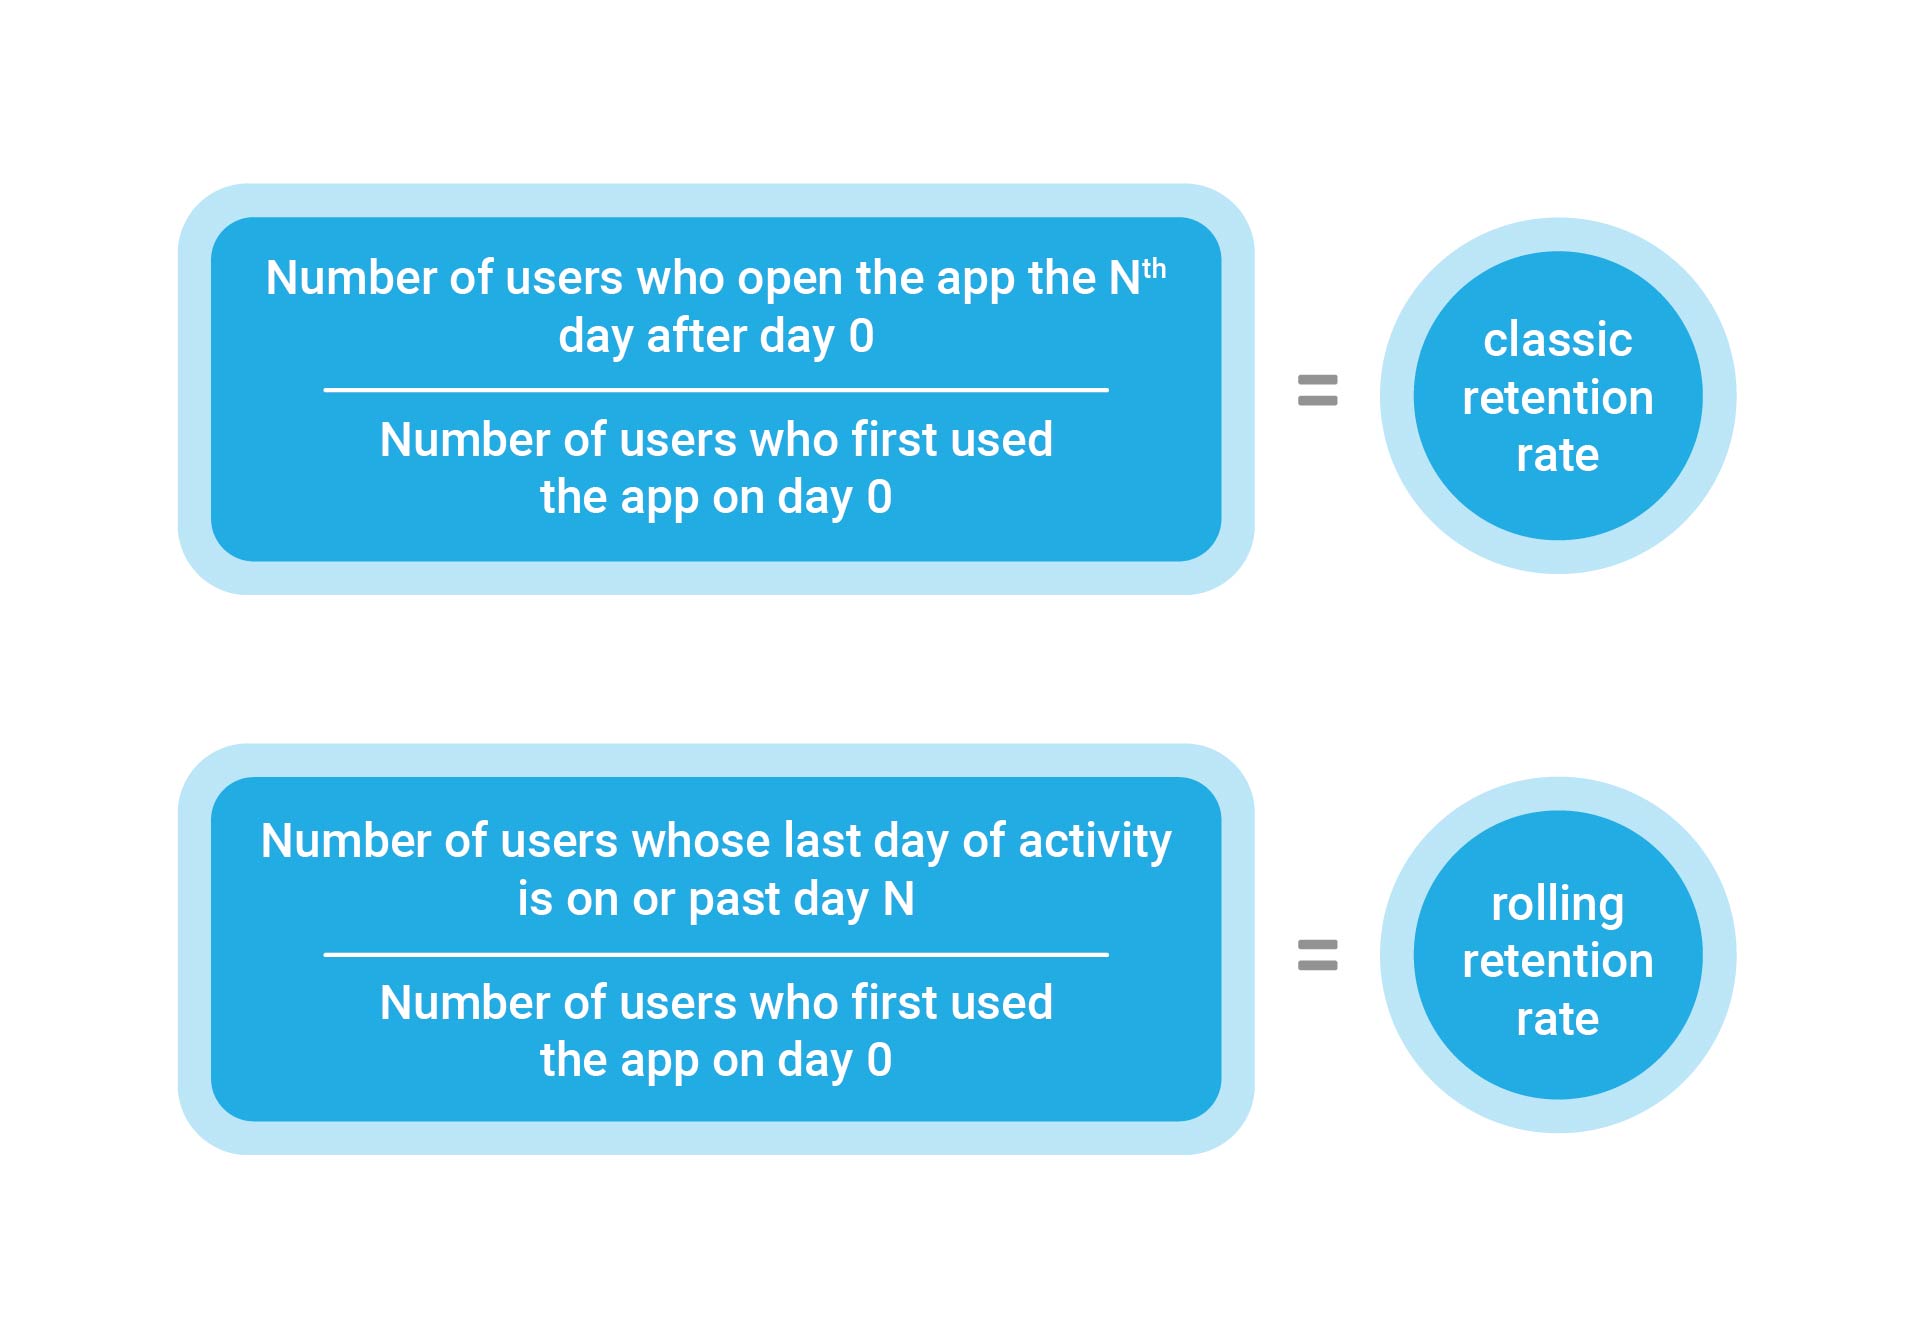
Definition of classic Day N retention and rolling retention
Day N retention shows the percent of users who return to the app on a specified day after their first launch.
Rolling retention shows the percentage of users who return to the app on a specified day or any day after that.
If Day 2 retention is 50%, it means that 50% of new users launched the app on day 2.
If Day 2 rolling retention is 50%, it means that 50% of new users returned to the app on day 2 or later.
Calculating classic Day N retention and rolling retention for a real app
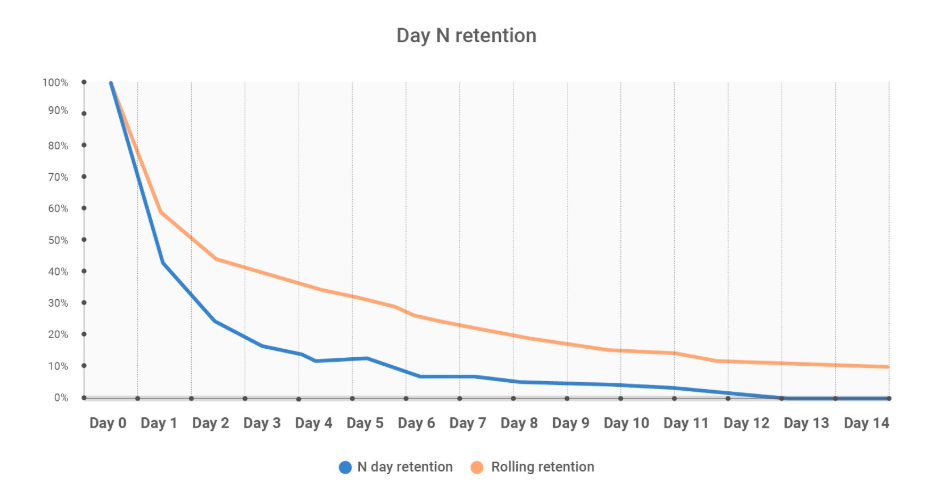
On the graph below you can see classic Day N retention and rolling retention calculated for the same app.
The difference between these two metrics is huge. And it gets bigger as we go from day 1 to day 14. Imagine you asked a product analyst to calculate retention, and for some reason, he calculated rolling retention instead of retention. There is a chance you will make a wrong decision about the product’s future development direction.
Let’s take a closer look at the difference between Day 1 classic and rolling retention.
- Day 1 classic retention is 43%, which means that 43% of new users launched the app on day 1 after they started using it.
- At the same time, Day 1 rolling retention is 59%, which means that 59% of new users launched the app on day 1 or later.
- That means that there were 43% of users who launched the app on day 1.
The main disadvantage of rolling retention
Rolling retention has one significant drawback, which is why it is recommended to use it only in cases when it is absolutely necessary.
The problem with this metric is that it can change any time. If a user suddenly returns to the app for the first time in 90 days, rolling retention for all of the previous days in the report will see an increase.
With classic retention, you know the exact percent of users who returned to the app by the time N days have passed since the first launch. Day N classic retention has no connection to data from other days and won’t change once you put Day N behind. In contrast, with rolling retention, the value for Day N retention might change 90 or even 250 days later.
When to use rolling retention
For the vast majority of tasks, classic Day N retention is much more useful than rolling retention. Therefore, it makes more sense to use the former.
There are rare cases where rolling retention is convenient. Usually, it is employed in products that aren’t used much. For example, if you want to analyze the long-term retention of a flight-booking app, then rolling retention can help. You will get an answer to questions such as “How many users returned to the app after 30 days?” But even in this case, standard monthly retention will provide valuable insights and you probably won’t need rolling retention.
Sometimes, companies want to look better in the eyes of investors or customers, and they use rolling retention in their reports and presentations. As you saw earlier – this can make your product look much better, especially if the people listening do not understand all the nuances of retention rate metrics.
Now you know what rolling retention is, and how it differs from the more commonly used classic Day N retention. If you suddenly come across it somewhere in your work, you will understand what it’s all about.
Where does the confusion between classic retention and rolling retention come from?
You might ask why do some people refer to rolling retention simply as “retention.”
In the beginning of the mobile analytics era, Flurry, a popular mobile analytics system, showed its retention metrics using “rolling retention” instead of “Day N retention,” confusing mobile app developers.
Later on, Flurry also introduced the classic Day N retention report. But it was too late, and it had already established a culture of using rolling retention as the default.
Calculating retention by 24-hour windows and strict calendar dates
Definition of retention calculated by 24-hour windows and strict calendar dates
We have discussed the difference between classic Day N retention and rolling retention, but there are more nuances to calculating retention metrics. Let’s discuss another one.
Day N retention can be calculated by 24-hour windows or strict calendar days. The difference seems to be insignificant, but as you will later see, the values of the retention metric can vary significantly depending on the method you use to calculate it.
When retention is calculated by 24-hour windows, retention charts will measure each user on their own rolling 24-hour windows, where Day 0 runs from the exact time of the First Event (usually the first time the user launches the app) through the next 24 hours, Day 1 runs from hour 24-48, and so on.
Let’s say we calculate retention by 24-hour window and Day 1 retention is 10%. What this means is, say out of 1,000 users, 100 came back and triggered some event between the 24th and 48th hour after their respective Start Action (e.g. User X launched the app for the first time on Tuesday at 4:00 pm, and then reopened the app sometime between Wednesday 4:00 pm and Thursday 4:00 pm).
When retention is calculated by strict calendar dates, retention charts will measure each user based on actual calendar dates. This means that if a user launched the app for the first time on October 1, at 11 pm, his day 1 will be the day of October 2, even though his day zero lasted no more than an hour (from 11 pm to 12 am).
You can read more about this in the documentation of the Amplitude analytics platform.
Calculating classic Day N retention by 24-hour windows and strict calendar dates
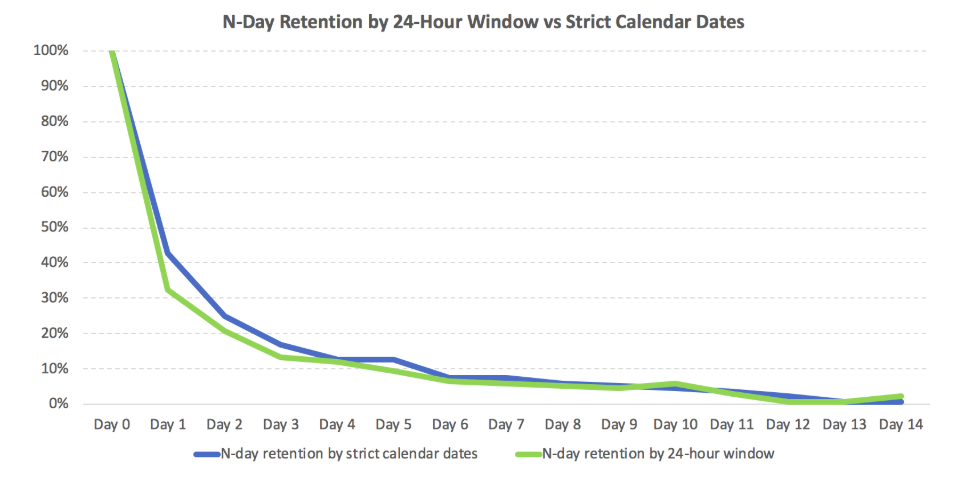
On the graph below, you can see the 24-hour window and strict calendar date retention for the same app that we examined above, when we were comparing classic and rolling retention.
In this case, the maximum difference between two ways of calculating retention is visible in the first days. Day 1 retention by calendar dates is 43%, while Day 1 retention by 24-hour window is only 32%. As we move further, the difference becomes less significant. Further down the timeline, the two lines almost merge, which is not unexpected.
Here’s why there’s a big difference in the Day 1 retention: Imagine a user launches the app for the first time at 11:50 pm on October 1. The user then launches the app again 20 minutes later, on October 2, 12:10 am. The user never returns to the app afterwards.
In this case, if you’re calculating retention based on calendar dates, then the user will be considered as “returned” on Day 1. But if you’re using the 24-hour format, then the user will not be taken into account in the Day 1 retention report. For that, she would have had to open the app between October 2, 11:50 pm, and October 3, 11:50 pm, the 24-48 hour time window following her first event.
Cases like this, where users launch an app for the first time before midnight and launch it again the next day before their first 24 hours expire, explain the difference you can see between the two ways of calculating the metric.
Why it is important to know if the retention is calculated by 24-hour window or by calendar dates?
We often use retention metrics to compare products between each other or to compare our product against benchmarks. That is how we make sense of the numbers we see, and that is how we know if the app’s retention is good or not.
Let’s say you are working on a casual mobile game. You soft launch an early version of the game. After a few days, you calculate Day 1 retention. It happens to be 32%. You don’t know if it is good or not. That is why you go and search for benchmarks on Google and find a report by Appsflyer.
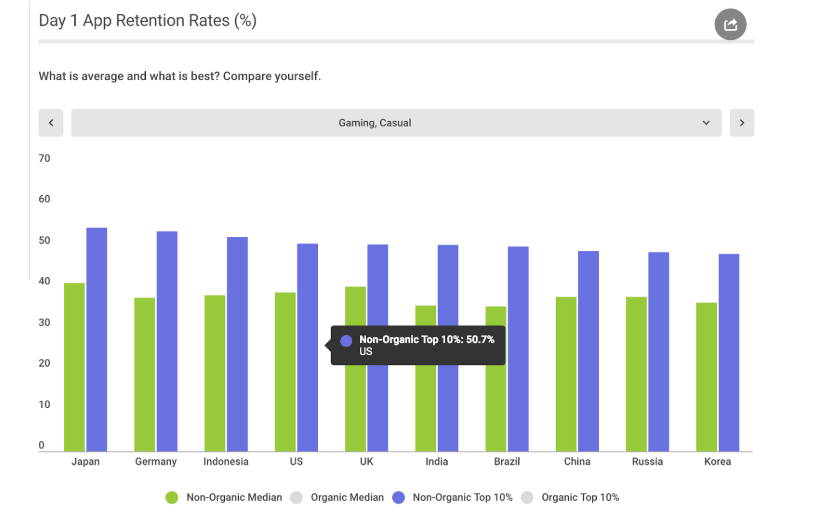
The report says that to be in the top 10%, Day 1 retention for a casual game should be above 50.7%. Your app is a far shot. The median Day 1 retention is 38.8%. Again, with a 32% Day 1 retention rate, your app is not even close. Based on this information, you decide to close the project.
However, that’s a mistake. By default, Appsflyer calculates retention based on strict calendar dates. Meanwhile, Amplitude, your analytics platform, uses the 24-hour window by default to calculate retention. If you calculate your app’s retention based on strict calendar dates, then Day 1 retention will be 43%. This puts you above average casual mobile games and not far behind the top 10%. This would probably change your decision.
Which method of retention calculation is better?
It depends. I would say that calculating retention based on 24-hour window will give you a more accurate answer to the question: What percentage of users return on Day N? However, it takes longer to get this data when you calculate retention by 24-hour window. For users who launched the app for the first time on a specific day, you will get the Day 1 retention only in two days (48 hours). In contrast, when you calculate retention by calendar dates, it will only take 24 hours to get Day 1 retention.
Considering this, I would use retention calculated by calendar dates when I need the data quicker. For example, for marketing analytics, where every day incurs extra ad costs, using the calendar date format will help you avoid spending extra money on a poorly performing campaign. When you can afford waiting for another day, retention by 24-hour window should be your choice.
But generally you can choose what you prefer. As long as you know what is exactly calculated, you will be able to draw accurate conclusions based on the data.
Summary
There are many different ways to calculate retention. And it is important to be very clear about what exactly you mean by retention and how is it calculated when you make decisions based on this metric.
→ Test your product management and data skills with this free Growth Skills Assessment Test.
→ Learn data-driven product management in Simulator by GoPractice.
→ Learn growth and realize the maximum potential of your product in Product Growth Simulator.
→ Learn to apply generative AI to create products and automate processes in Generative AI for Product Managers – Mini Simulator.
→ Learn AI/ML through practice by completing four projects around the most common AI problems in AI/ML Simulator for Product Managers.