
Many articles online compare the freemium conversion rates of Spotify, Dropbox, Slack, and Evernote. In one article, the author claims that Spotify’s freemium conversion tops Dropbox by 667%. Another article states that Spotify freemium conversion rate is above 40% while “for most companies that leverage this business model, freemium conversion rates hover somewhere between 2 and 5 percent.”
In this post, I will dispel the myth that Spotify’s conversion rate is somewhere around 40-50%. More importantly, I will discuss why It is very important to be clear about what data underlies a certain metric because people sometimes use the same metric name but in effect, they mean different things.
→ Test your product management and data skills with this free Growth Skills Assessment Test.
→ Learn data-driven product management in Simulator by GoPractice.
→ Learn growth and realize the maximum potential of your product in Product Growth Simulator.
→ Learn to apply generative AI to create products and automate processes in Generative AI for Product Managers – Mini Simulator.
→ Learn AI/ML through practice by completing four projects around the most common AI problems in AI/ML Simulator for Product Managers.
Why do people think Spotify’s paying conversion rate is over 40%
In many articles, authors give estimates of Spotify’s subscription conversion rate. Here’s how they do it in general:
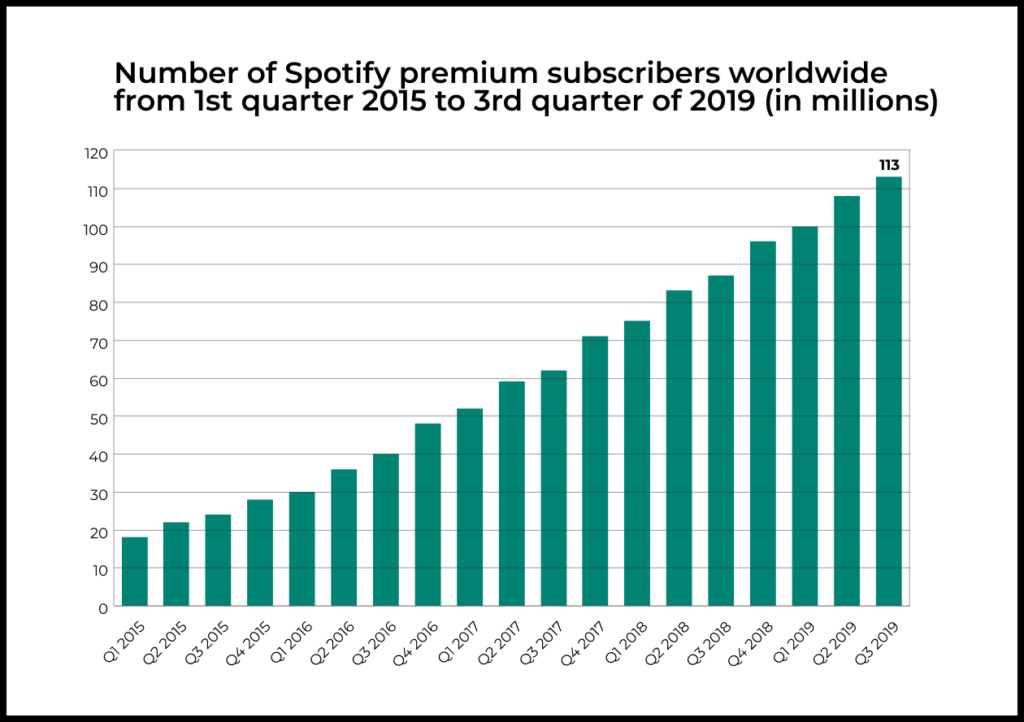
Spotify had 113 million paying customers as of Q3 2019.
In the same period, Spotify had 248 million active users.
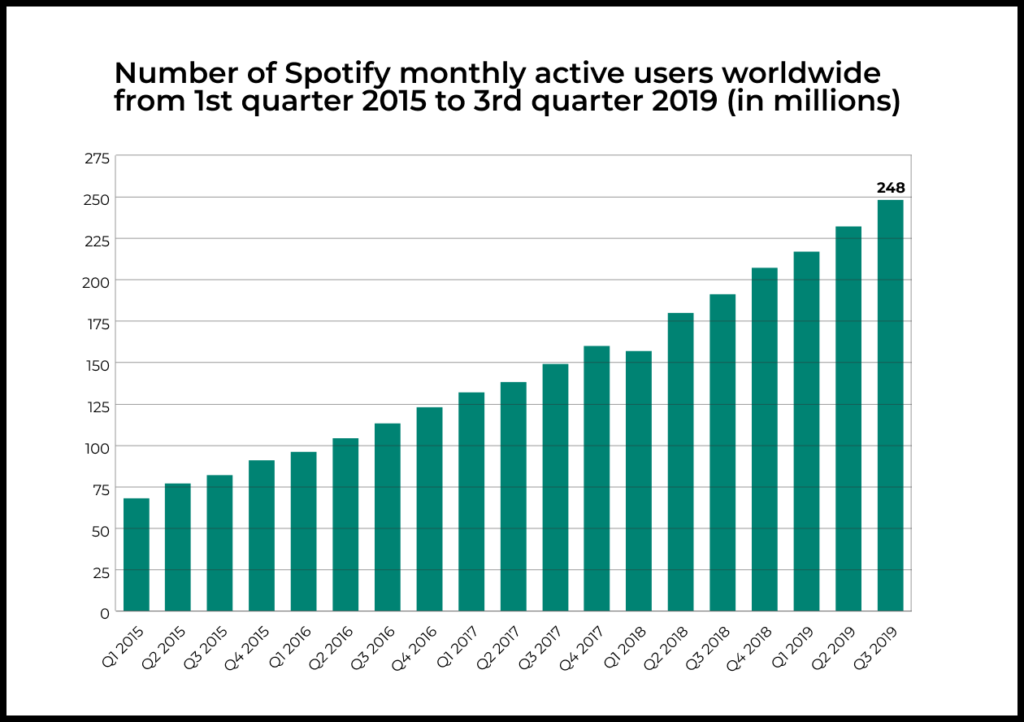
Based on the logic posited in the articles mentioned above, the conversion rate of Spotify’s users into paying subscribers is 113 / 248 = 45.5%.
But that is the wrong way to estimate the percentage of users Spotify converts into paying subscribers. The formula mentioned above calculates the ratio of paid users to active users, which is completely different from the conversion rate of new users into paying users.
How to estimate the real conversion rate of new Spotify users into paying users
The steady growth of Spotify’s MAU on the scale of tens of millions of users indicates that the product converts new users into permanent ones, which means its retention plateaus. In this case, we can justly estimate Spotify’s long-term monthly retention rate.
We know the following:
- From Q3 2018 to Q3 2019, Spotify’s MAU grew by 57 million users (MAU in Q3 2019 = 248 million users; MAU in Q3 2018 = 191 million users).
- According to AppMagic, Spotify was downloaded 195 million times from Google Play and Apple App Store between Q3 2018 and Q3 2019.
- To get an upper estimate of Spotify’s long-term retention rate, we must calculate the ratio of the app’s MAU growth in that year over the number of new users who joined the app during the same period (we assume that old users rarely leave the product).
- Therefore, a rough upper estimate of the long-term monthly retention rate would be 57 / 195 = 29%.
- We did not consider the fact that some of the downloads are made by old users who got a new smartphone, and the fact that Spotify has a desktop and web version and gets new users on these platforms too. Also, it’s important to keep in mind that the conversion rate will vary depending on region, platform, and other factors. For simplicity, we are not going to account for these factors in this analysis.
How can a product with a long-term monthly retention rate of around 30% have a 45% paying subscription conversion rate from new users? The short answer is: “It can’t.”
Here’s the breakdown: Let’s assume that the long-term monthly retention rate of Spotify plateaus at around 29%. At the same time, about 45% of these customers are paying ones. That means that ~13% of new users keep paying for the service in the long term. This is still a very high figure.
It’s important to understand that this is not the purchase conversion rate of new users. This metric will likely be even higher since users can purchase the premium version and then unsubscribe. What we have estimated is the percentage of new users who will remain premium subscribers in the long term.
Here is the data on Spotify’s premium subscribers churn-rate from their S-1 filing:
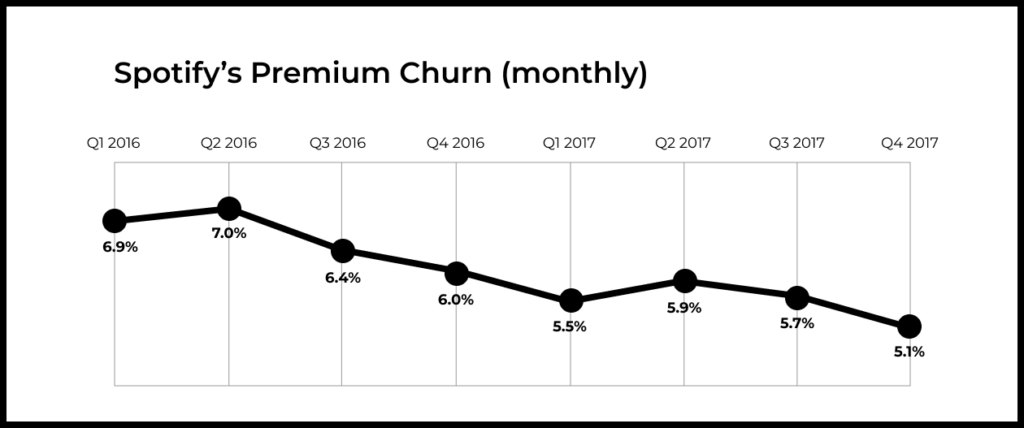
An important quote from the document: “Based on historical data from the beginning of 2015 to date, approximately 40% of the Premium Subscribers who churned rejoined within three months, approximately 45% rejoined within six months, and 50% rejoined within 12 months.”
Considering the descending trend of churn rate on the graph above we can assume that in 2019 Spotify’s monthly churn rate should be around 3-4%. We also know that 50% of Spotify’s churned users rejoin within 6-12 months, so the real churn rate should be around 1.5-2%. If we make an assumption that the paying subscribers’ retention curve flattens out after 6 (optimistic scenario) to 12 (pessimistic scenario) months, that means that Spotify’s new user purchase conversion rate is somewhere between 14.2% and 16.4%.
What’s wrong with dividing paying subscribers by monthly active users?
The problem with the logic in the articles mentioned above is that when calculating the conversion into paying customers for Spotify, the authors divided the number of paying subscribers by the number of active users. As you just saw, this is a completely different metric with a completely different meaning, and it should not be interpreted the way it was in these articles. If the authors wanted to know how Spotify’s product converts new users into paying ones, they should have divided the number of users who made a payment (not the number of those who keep paying) by the total number of new users (not active ones).
Here is a simple example. Assume that product X converts 1% of its new users into paying customers, and its long-term retention rate is also 1%. Only those who paid will continue using product X. If we apply the logic used to evaluate the conversion rate of Spotify in the articles, product X’s conversion rate will be 100%. But we know that it is just 1%. The product has a really bad retention rate.
This is why it is actually a pretty bad idea to compare the paying conversion rates of different products in the way it is done in the articles. The ratio of paying users to active users is affected by a few things, including the long-term retention and monetization ability of the product, so you should be very careful when making conclusions based on such a metric.
A similar mistake about Slack’s paying conversion rate
Here is a link to the analysis of Slack’s business model. The authors claim that Slack converts 30% of new signups into paid users:
“How Slack converts 30% of their free users to paid users. Here’s the final piece of the puzzle. Sure, Slack could be using all of the tips above to get free sign-ups… but what’s to guarantee these become paying users later on?”
In this case the authors made two mistakes.
- First, it is wrong to estimate the conversion rate of free signups into paying users by dividing paying users by active users. This is what we discussed above.
- Second, in this particular case, the metric for the conversion rate of paying end users doesn’t make much sense. Slack is a SaaS product and end users do not pay for Slack. The licenses are usually bought by companies. In this case, it will make much more sense to consider what percent of new organizations (teams or companies) convert into paying ones.
In my analysis of Slack’s S-1 filing, I estimated that the conversion rate from a new organization into a long-term paying customer for Slack stands at around 0.8-1.6%. If we factor in the average churn for SaaS (approx. 50% of new customers will churn over the first year), then the conversion rate from a new organization signing up with Slack into one that pays at least once will stand at around 1.5-3.5%.
Why it’s important to explain what data underlies a certain metric
It is very important to explain what data underlies a certain metric because people sometimes use the same metric name but in effect, they mean different things.
For example, the paying conversion rate can refer to any of the following:
- The percentage of new users who make a purchase during the entire time they use the app
- The percentage of new users who remain paying subscribers for a long time
- The percentage of the daily active audience that makes a purchase
- The percentage of MAU that makes a purchase
- And so on.
All of these metrics will have different meanings. All of them characterize completely different things. However, we cannot tell if any of them are good or bad. They just answer different questions.
Conclusion
When discussing metrics and data, make sure to always clearly define what you are talking about. Otherwise, there is a likely chance that different people will use the same term to describe completely different things.