
Creating the app of your dreams can be a daunting challenge. But an even greater challenge is making sure your users find and experience its value. To do this, you need to have visibility on how users navigate through your app and interact with its features.
This is where analytics and event-tracking platforms come into play.
Analytics help you answer important questions about your users such as what do they like about your app, where are they struggling, which features need improvement, which features are hindering the user experience, and many more.
The foundation of analytics is data collection. Every analytics platform comes with a software development kit (SDK) that you can integrate into your app to send events. Developers add code that calls special application programming interfaces (API) in the locations where an event must be fired (for example, when users launch the app for the first time or when they send a message). If event logging is set up poorly, you will be blinded when working on your product, or you will work with erroneous data, which in my opinion is even worse than not having any data.
In this article I will be talking about the following:
- Common mistakes in setting up analytics for mobile apps
- The right approach to integrating analytics in mobile apps
- Some hacks that will allow you to use data more efficiently
→ Test your product management and data skills with this free Growth Skills Assessment Test.
→ Learn data-driven product management in Simulator by GoPractice.
→ Learn growth and realize the maximum potential of your product in Product Growth Simulator.
→ Learn to apply generative AI to create products and automate processes in Generative AI for Product Managers – Mini Simulator.
→ Learn AI/ML through practice by completing four projects around the most common AI problems in AI/ML Simulator for Product Managers.
Why do we need to track events in mobile apps
Mobile app analytics are usually based on events. As users interact with the app and perform different actions, events are sent to and stored in the analytics server. Developers then study the collected data to find answers to their questions.
An event is any action that a user performs (clicking on a button, opening a specific screen, adding a comment, making an in-app purchase). When the user performs the action, the app sends an event to the analytics system’s servers. Together with these events, the system also collects a set of default event and user properties (such as the user ID, app version, device model, etc), as well as a number of additional custom properties that you set up yourself (e.g., number of days since the user started using the app, number of app launches, etc).
This approach is more exhaustive and complicated than setting up standard analytics systems such as Google Analytics, which are designed for websites. But it gives a much better understanding of what happens with the product and allows you to answer many more questions.
Common mistakes in setting up mobile app analytics
When developing a mobile app, product teams often don’t invest enough time and resources in properly designing event structure and integrating analytics. An incorrect or low-quality analytics setup will considerably complicate subsequent work with the product, and sometimes leave your product flying in total darkness without any navigation devices to lead it.
I’ve noticed the following common mistakes when setting up analytics:
- Last-minute setup of events: Product teams postpone analytics setup until the very last moment. When it comes to releasing the app, analytics is just one of the many problems the team has to take care of. Consequently, analytics setup loses priority and importance, and the team doesn’t allocate enough time and resources to thoroughly think about what data should be collected and why.
- Logging too many events: Sometimes, the app logs too many events, regardless of whether the data is useful or applicable. This is not an optimal approach. The data you collect might be suitable to answer the future questions you will have—or it will require a lot of additional work to transform it so that it will be able to help you. Also, collecting too many events increases the chances of making mistakes at the integration stage. Additionally, it will be more challenging to support the integrity and reliability of your data in the future when you roll out new updates.
- Logging too few events: At the other extreme, you might log only the most important events based on the team’s opinion. And then it turns out that the data you collected doesn’t answer your key questions.
- Disregarding the features and limits of analytics systems: When setting up the analytics, product teams sometimes don’t take into account the restrictions imposed by the functionality of the used system, which again makes it impossible (or difficult) to get the needed answers once the product is launched. For instance, some analytics systems set limits on event properties or the number of steps in funnels. These characteristics can affect your event deployment plan.
Zooming out a bit, all of the mistakes we described above stem from thinking the wrong way about analytics. Analytics is designed to answer questions, so the logical way to approach it is to develop a set of questions first and then form a structure of events that will help to answer those questions, not the other way around.
The process for creating the events structure for a mobile app
Step 1: Define key questions you want to answer
First, you need to decide which questions you want to answer with the data you collect from your app, and which hypotheses you want to validate. Imagine the app is already out there, and it’s time to conduct an analysis. What do you want to know?
I recommend the following approach when formulating key questions: Write down the main user scenarios, and then imagine the user going through them. What are some of the interesting questions you would want to ask?
The final list usually consists of a general section that contains common questions applicable to most apps, and a set of questions that are specific to this particular app.
The standard part usually looks like this:
- At which steps do users churn during the onboarding flow?
- How effective is the onboarding flow (how many users actually understand how to use the product by the end of onboarding instead of just clicking “skip” through all the steps?)
- How many people continue using the app after 1, 7, 14, 30 days?
- What share of new users see the screen with the premium version of your product (or see an in-app purchase offer)?
- What is the purchase conversion rate? What percent of users make repeat purchases?
- How much does it cost to acquire one user?
- How much do we earn per user by the 1st, 7th, 14th, 30th day?
- How do the answers to previous questions differ across different platforms, device types, countries, and traffic sources?
- Which features do users use often? Which features are not used much?
After you compiled a list of questions, ask other team members what they want to learn about the users interacting with the product. If you skip this part, it may turn out, for example, that you’ve included the key game design questions, but totally left out the interface-related or UX-related ones.
The result of this step is a list of questions, which will help you structure future research of your app.
Step 2: Specify the events and properties you need to answer the questions from step 1
Now that you have an understanding of what exactly you want to know, you can proceed to designing the structure of the events and their properties. Don’t spend too much time on it at this point. Quickly create the first version of events structure and move to the next point.
Step 3: Make sure your analytics system conforms with your event structure
Functionality, capabilities and limitations vary across different analytics systems. You must take all these factors into account when you create the events structure for your app. You are probably well aware of the features of the analytics that you use. Nonetheless, let’s take a look at a few examples that make it clear why this is important.
Example 1
Flurry sets a limit on the number of properties it transmits with an event (no more than 10 properties for a particular event). Therefore, when creating the event structures and properties, you need to keep this in mind.
Example 2
If you are using Google Analytics for event tracking, then you should be aware that events in Google Analytics do not have properties.
An Event in Google Analytics has the following components: Category, Action, Label (optional, but recommended), and Value (optional).
This means that you won’t be able to send all the information you want with each event. For example, you might have wanted to send the “Level completed” event from your game with the parameters including level, score, time_to_complete, etc. In Google Analytics, you must either choose the most important things or send several events containing all this information. The latter will cause further complications when you want to analyze the data.
Example 3
Let’s look at another example from Google Analytics. Google Analytics has no funnel tool like in Amplitude or Mixpanel. So if you want to analyze core funnels in your product, you must set up goals. And you have to do it in advance.
Technically, you can do funnel analysis with Google Analytics data. But to do that you will have to use Google Analytics API.
Step 4: Revise the previous steps
After going through steps 1-3, take another close look at your list of questions and event structure. In most cases, you’ll realize that you’ve missed some important pieces. You’ll also find plenty of opportunities to optimize the event structure to simplify the subsequent work with data.
Step 5: Set up your analytics system
At this stage, you need to explain the idea behind every event and event property to the developer team. Tell them when and under what conditions each particular event is sent, why you need it, and what you want to understand/find out/check.
This is important because many mistakes happen during the integration step. There are different reasons for these mistakes, but one of one of the most common is developers misunderstanding the logic behind a specific event or event property, or having an interpretation that is different from yours.
The conscious setup of events in your mobile app will pay off in the future by saving a lot of your time.
Step 6: Test events before the release
To make sure your analytics setup functions properly, you can simply verify that the system collects the events and their properties.
But to be completely sure that everything is working correctly, I recommend using the following approach.
Open the tool that allows you to see the new events from users in real time (most analytics systems have such a feature). Download and install the app with integrated analytics, and start testing all the events. Check that all the events are logged at the right time, and that all event properties change in accordance with the logic you have come up with.
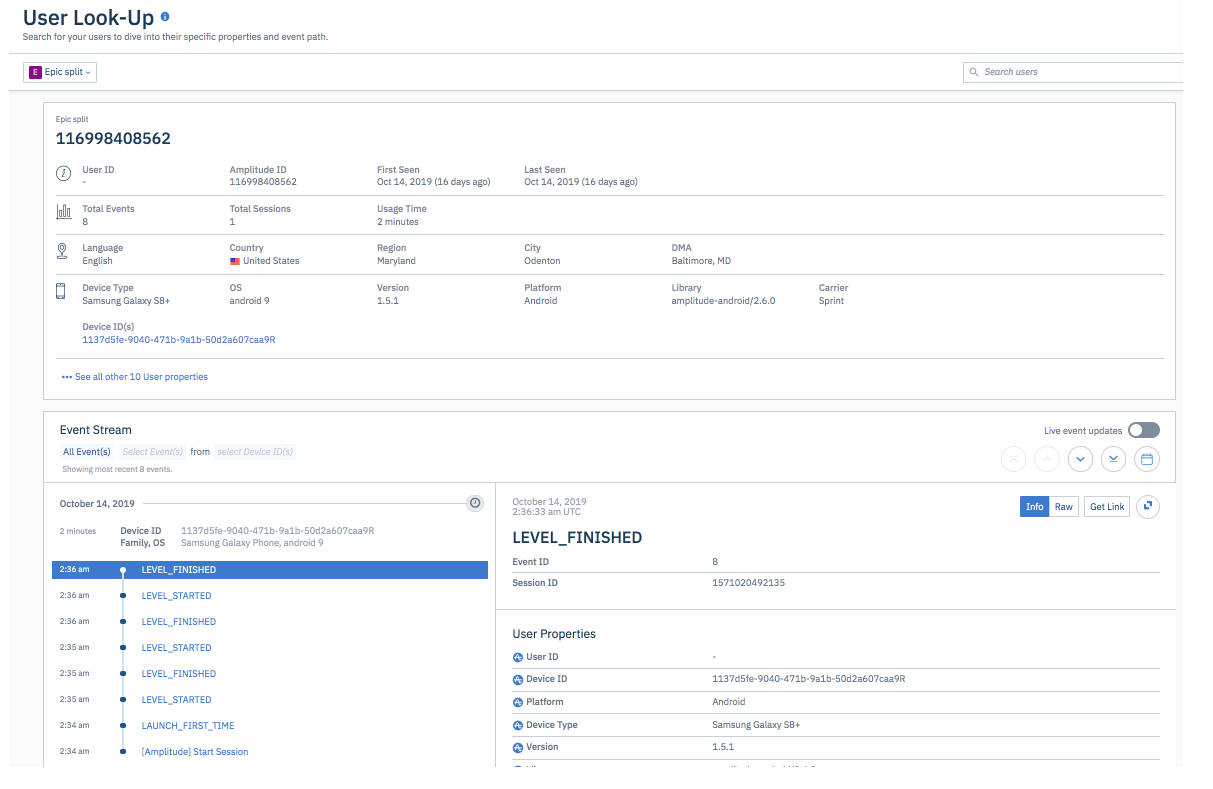
Mixpanel and Amplitude have a Live view tool, which allows you to monitor and filter incoming events in real time. For example, you can do something in the test version of the app and immediately see these events as they’re logged in the analytics system.
I recommend checking mobile analytics events very carefully for at least two reasons:
- Updating analytics in a mobile app takes a lot of time (developers have to make changes, the Q&A team must make sure that everything is OK, then you must submit the updated app to the app store, then you have to wait until users update to the new version).
- In my experience, having incorrect data is even worse than not having any.
The six-step mobile app analytics setup process described above may seem quite complicated. But in reality, it is simple and clear.
To summarize everything described above in one sentence: Before integrating analytics in your app, think about what you want to know from your data and make sure your analytics system can give you this knowledge with the existing event structure.
Useful hacks when setting up analytics in a mobile app
User properties
One hack that I’ve found very useful in mobile app analytics is sending certain properties with all events. In Amplitude it is called user properties.
User properties usually characterize the user and not the action that triggered the event. I usually add the following properties to this list:
- The date the user launched the app for the first time (you can store it as a number in the following format YYYYMMDD – it allows you to filter it easily).
- Traffic source
- Number of purchases
- Total revenue from the user
- Key actions made (may vary by product)
Send data to at least two analytics systems
Even with a careful verification of statistics at the testing stage, some errors still occur. Therefore, it is better to log data in at least two systems in order to be able to verify its accuracy. I suggest using Firebase as a convenient backup analytics system. It’s free and quite powerful.
Сheck whether analytics system tracks payments correctly
In case your analytics system tracks payments and other financial data, you need to take extra measures to make sure your stats are correct. One tried and tested method is verifying purchases on your app server before logging any payment events in the analytics to make sure you don’t register false and abandoned purchases. Otherwise, cheaters might game the system and compromise the accuracy of your payment data.
How to support your event structure
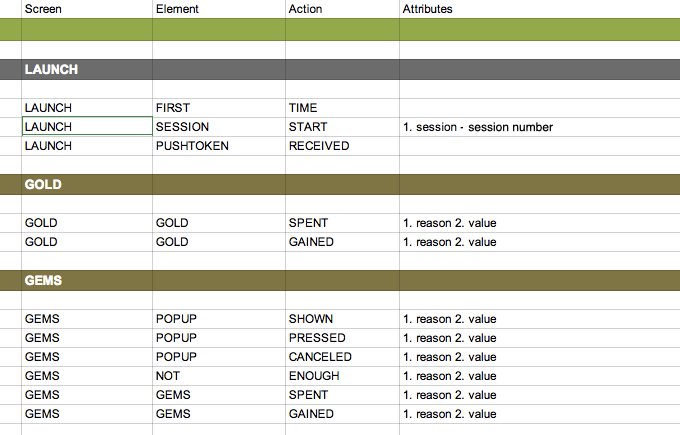
Google Sheets is a great tool for storing and maintaining event structures. Create a new tab for every version of the app and color the events added in each of them. In this case you will always be able to track changes in the event structure.
How to name events
In order to avoid confusion in the event names, it is handy to name them based on the “Object + action” convention.
For example, the start of a new game level can be called “Level started,” and a purchase in the store will look like “Premium purchased.”
This will make it easy for anyone to map actions to events. It will also help you categorize and browse through your events, because all actions with a specific object will be shown next to each other in the interface.
Summing it up
Here I want to repeat the idea of this article in one sentence. Think in advance about what you want to learn from the data collected, and make sure that your analytics system is able to give you this knowledge with the existing event structure in advance.
If you have your own hacks for embedding analytics in mobile apps, feel free to share them in the comments below. Thank you!
→ Test your product management and data skills with this free Growth Skills Assessment Test.
→ Learn data-driven product management in Simulator by GoPractice.
→ Learn growth and realize the maximum potential of your product in Product Growth Simulator.
→ Learn to apply generative AI to create products and automate processes in Generative AI for Product Managers – Mini Simulator.
→ Learn AI/ML through practice by completing four projects around the most common AI problems in AI/ML Simulator for Product Managers.