The general perception is that data analytics and data-driven product management is more suited for business applications, social media apps, and communications platforms. But the reality is, any kind of product can benefit from a data-driven perspective.
One of the domains where the value of data is often underestimated is games.
In my experience, most teams working on mobile games don’t fully use the potential of data. They tend to track topline metrics, measure effectiveness of paid marketing campaigns, analyze the impact of product changes all while running meticulous AB tests. This may sound like enough, but it really isn’t. Not if your goal is to climb onto the top of the grossing charts and stay there.
There are many more ways how data can increase your chances of building and operating a successful mobile game. The key is to stop thinking of data as a way to look back at what you have done, but instead start using data as a tool that can help you make decisions, decrease uncertainty and remove main product risks as early as possible.
In this post, I will walk you through a few examples of how data can drive key product decisions at different stages of product development cycle. But first, let me tell you a story…
→ Test your product management and data skills with this free Growth Skills Assessment Test.
→ Learn data-driven product management in Simulator by GoPractice.
→ Learn growth and realize the maximum potential of your product in Product Growth Simulator.
→ Learn to apply generative AI to create products and automate processes in Generative AI for Product Managers – Mini Simulator.
→ Learn AI/ML through practice by completing four projects around the most common AI problems in AI/ML Simulator for Product Managers.

A simple test that will increase your chances of success while reducing your development costs
In 2014 I was working on a mobile game in which players fought each other on an ice field. Each player had a team of three warriors, whom they threw to challenge the rivals’ teams. It was supposed to be a game with a synchronous multiplayer mode.

For the first version of the game, we decided to have only a single-player version, where the players would fight against the AI. This decision was made to save development time and test the game earlier. We planned to add the multiplayer mode in the future update. But it still took us 4 months to get from the idea to the test launch.
Soon after launching the first version of the game we analyzed the key metrics and here’s what we learnt:
- The game had a good short-term retention (Day 1 retention rate > 45%), but by the 14th day, the retention rate would fall. This was no surprise as there was little content in the game.
- The monetization didn’t look that bad. And, there were great possibilities for improvements.
- However, we had huge problems with user acquisition. The choice of a gameplay and the visual style were solely based on the team’s gut feeling. As a result, the CPI (cost per install) from Facebook ads was as high as $15 in Australia. It was simply too high for a game that was on the casual end of mid-core games. And no, we didn’t do any optimization of creatives, that could have brought the CPI down.
While these are all great learnings to acquire in mere 4 months of development work, the truth is that we did not have to build the game to find out that the user acquisition will be a problem and that the players (market) didn’t want our game. But we were blinded by our initial game idea and believed that it would work. No one tried to challenge whether it was worth building what the team originally had in mind.
In hindsight, we should have used the Splitmetrics platform or any other similar tool to test the market’s interest for the product we wanted to build. Splitmetrics allows developers to make a fake app store page and check the acquisition funnel without publishing the app in the app stores. All that is required for a test like this is few banners, and icon, a description of the game, and some illustrations shown as screenshots of “the game”.
Would we have started a full-stack development if we knew that the CPI would be $15? I doubt it. If we knew that there and then, the right approach would have been to focus first on finding ways to reduce the CPI dramatically. If we had failed to reduce the CPI, we would have stopped the project without spending hundreds of thousands of Dollars in development costs – not to mention the opportunity costs.
Before we started the development of our next game, we made a lot of versions of the art style and tested them with Splitmetrics. The best version was performing several times better than the second best. This test gave the project a huge advantage – the user acquisition costs were way lower than the market average, and we were able to prove from the get go that the market wanted the game we were planning to build.
This second game was CATS. It would get over 100 million downloads and several recognitions, such as being nominated as the best game of 2017 by Google Play.

This story is just one of the examples of how data can help to reduce uncertainty, allow to invest resources smarter and increase chances of building a successful game.
If you’re still on the fence, let me turn you into a believer with more examples…
Analyze and understand your target segment
A few years ago, I wanted to learn more about ASO (App Store Optimization). As with most things, the best way to learn is through practice and that is why I decided to build a game with a goal of growing it through organic traffic.
At that moment I faced the questions every game maker faces – how to choose what game to build? This is an important question, because if you choose the wrong market segment or overestimate your resources – you will most likely fail.
I started researching the market to understand what are the market segments where games rely mostly on organic traffic. Then I spent a week analyzing each of the segment: Who are the leaders in the segment? How do they get organic traffic? What are the potential ways to outperform them? I also spent a lot of time creating and analyzing the semantic core of each niche that looked promising:
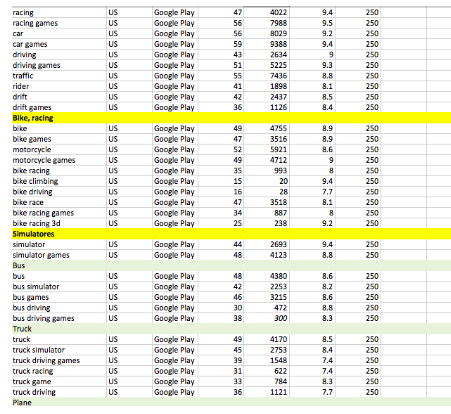
After the analysis, I decided to build a Truck Simulator game. There were a few data-backed reasons behind this choice:
- It was the niche with a lot of organic traffic. Most importantly, it was a growing niche. Top games inside the segment were getting millions of downloads per month (I used Sensor Tower and Datamagic for the analysis).
- Even though there were clear leaders in this segment, there still were many apps with more than 100k installs per month. That meant that there were many different ways how the games got organic traffic.
- Most games had low production values and monetized through ads. That meant that their LTV was low, and they could not afford paid user acquisition. This was good news for me, as I could not afford paid UA either.
- These games didn’t acquire users through paid ads. They were not featured by app stores either. They survived purely on organic traffic from searches and occasional app store’s recommendations.
- All the games looked and played largely the same. The gameplay was very simple: user gets a truck and drives around the area delivering goods. Neither gameplay, nor controls were adapted to a mobile devices.
Understanding all this I started thinking about the game I could build that would give me an advantage over a slew of largely identical competitors. I ended up creating the Epic Split Truck Simulator – a casual arcade game with a fun, and to some extent, hardcore gameplay. It was inspired by the famous Volvo truck ad where Jean-Claude van Damme made a split between two moving trucks.
The game was built over at weekend and as of today raked over 2 million downloads (99% of them organic). The main reason why the game grew was that it outperformed the competitors in store conversion and short term retention. That is also why Google Play decided eventually to recommend our game instead of any of our competitors’ games.
The key lesson here is that a deep analysis of the market you want to enter is crucial for a future success. It will inform your decisions and help you focus on the right things. Here are the questions worth thinking about before you get into full-on development:
- Is this segment of the market growing or stagnating? Needless to say, it’s always easier to work in a fast-growing market.
- How strong is the competition? Is it the sub-category dominated by one or two games or are there many games with small and medium market shares? Do the category leaders change quickly, or do they remain on the top for a very long time? You’re looking for a market that is not dominated by one or two games leaving only crumbs to the others. A market where the top games change from time to time offers potential for newcomers.
- How did the leading games in the sub-category achieve their positions? Did it require aggressive paid marketing, or do they also accumulate a lot of organic traffic? Are the games regularly featured, or are they growing through cross-promotion inside the portfolio of the same publisher? What is the LTV, RPI, and retention rate of the top games in the category? Are they top of mind games? What is the art styles of these games?
- How and in which areas is your game going to beat your competitors? What is the added value of the game you are building? Will you find a way to grow through paid ads on the market where everyone else is getting organic traffic? Do you know how to significantly improve the LTV compared to the rest of competitors? Are your product and/or marketing improvements sustainable or are they something that other games in the category can quickly replicate?
Answering these questions will help you focus on the right things. You have to do something better and/or differently to be able to win a meaningful market share.
Deconstructor of Fun offers yearly a great analysis of the mobile market that helps to identify where you should and shouldn’t compete:
- https://www.deconstructoroffun.com/blog/2018/1/9/prediction-for-2018-casual-games
- https://www.deconstructoroffun.com/blog/2018/1/31/prediction-for-2018-mid-core-games
The Early Signs of Success
I have participated in making a few games, which became hits: King of Thieves (over 75 million downloads, Apple’s Editors choice), C.A.T.S. (over 100 million downloads, rated best game of 2016 by Google Play) and Cut the Rope 2. I have also worked on many more games that never made it.
My experience led me to identify a couple of early signs that a game has problems. I found it useful to monitor these signs from the early development stage onward when teams tend to be over-optimistic. Just keep in mind, that these are signs rather than definitive symptoms.
Sign 1: Testers can’t stop playing your game
I find testing an early version of a game on the Playtestcloud very useful. The way Playtestcloud works is that it requires a player (which you choose based on various segmentations) to play your game for 30 minutes straight. The test is recorded by recording the screen, the touch points and the microphone of the tester. This test provides you with a very useful qualitative data and gives you a chance to see the games through your players’ eyes. I also like the test as it is done in the comfort of the tester (usually at home) instead of bringing testers to your studio or some research center, where their behaviour alters.
I noticed an interesting pattern with the Playtestcloud tests: testers spent more than 30 minutes in a game that would later prove to be successful. The testers simply got really engaged with the early version and didn’t want to stop playing. On the other hand, in the games that were later killed, the testing sessions lasted exactly the required 30 minutes or less.
Sign 2: The development team doesn’t play their own game
It’s a great sign if you get a community of people inside the company who play the early versions of your game and give you a lot of feedback as well as send you ideas regarding the game. Especially if a significant part of this community is not part of the team building this game. On the opposite – when even the team members avoid playing the game during their free time and do so only because that’s their job–most likely it’s usually because something is off and the game is simply not engaging enough.
These are not scientifically proven signs. Then again, building games is not a scientific process either. Most likely you will notice other similar patterns that will work for you and will help you navigate through the uncertainty in the early days of building a new game.
I definitely do not recommend killing the game if testers fail to spend over 30 minutes playing it or if there is no engaged community in your company around the early versions of the game. I also don’t recommend keeping a game alive even if the development team really loves it despite all other signs pointing that the game is a dud. These are just signs that something might be going in the wrong direction.
The most important question to answer after the launch
It’s time for yet another story. This time about a game called King of Thieves, which has more than 75 million downloads as of today. When we launched the first version of this game after 16 months of development the early metrics looked really bad, with D1 retention rate of 26%, which declined down to mere 9% after 7 days. Monetization-wise, things didn’t look any better. It took four days before the first purchase was made. Low conversion and low retention tend to make a pretty bad combination.
Based on this data we should have killed the game, but we decided to invest more time into understanding what was going wrong. We knew that the game was fun–we had a big community inside the company who played the game while we had been building it. Not to mention that the playtests on Playtestcloud usually lasted for more than the required 30 minutes.
To understand the reasons behind the poor KPIs we started comparing the paths of those users who would retain and those who would churn. To do that, we got a random sample of successful and unsuccessful users and then manually analyzed the sequences of their in-game events. There is a great tool in Amplitude that allows you to do that:
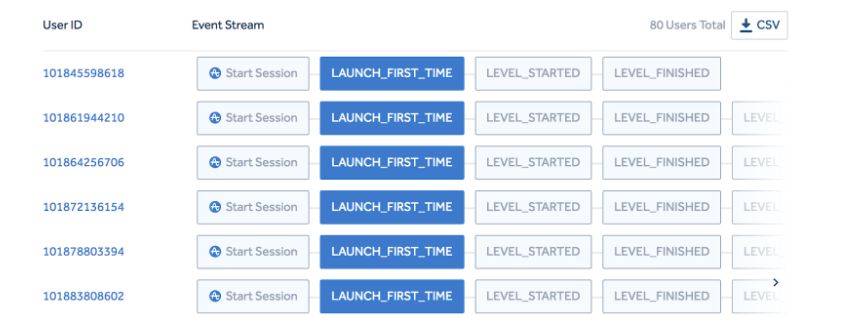
We quickly noticed that retaining players discovered the Player versus Player (PvP) very quickly and spent most of their play time fighting others. On the other hand players who churned never attacked other players. Upon discovering this crucial insight we calculated that 60% of the new users never tried a multiplayer – the main and the most exciting part of the game’s core loop.
We changed the onboarding flow to force players to engage with the PvP mode and the impact was immediate – D1 retention soared to 41%, while the D7 rate increased to a far healthier 20%.
The main lesson here is that you should strive to understand what are the key elements that make your players retain. One of the best tools to do that is to manually analyze the sequence of events of retaining and churning players.
A deep understanding of what exactly keeps your users engaged is the key for the future development of the game. As soon as you understand the core element of your game–all of the new features you add should amplify this. Also, looking back at it, we should have understood that the PvP was the main driving element in King of Thie. Afterall, that was the game mode everyone engaged with internally during the development of the game.
Test early, test hard
In my opinion, a mistake that many teams make is acting with too much caution in the early days of working on a new game. They avoid running risky experiments and they don’t attempt to shift the game into different directions.
There are a few reasons why I advocate for aggressive early experimentations:
- Every game is like a new universe with its own set of laws. You have to learn these laws from scratch and the best way to do this, in my opinion, is to run experiments.
- Another important thing is that in the early days you have only a few users so you can run aggressive experiments without causing any uncorrectable problems. In other words, early stage is the perfect time to make mistakes and learn from them. Even if the experiment turns out a big mistake it will help to learn more than it causes harm – after all, we’re talking about games with merely a few hundreds of users. That’s definitely not the case when the game has scaled up.
- You have to test things that can have a significant impact on the metrics to be able to get statistically significant results. Otherwise you won’t be able to learn anything from an experiment. Early on, your player base isn’t yet big enough to acquire statistical significance in experiments.
But let’s get back to King of Thieves. After changing the onboarding flow and fixing the retention rate we still had big problems with the monetization. We were far from being ROI positive (we couldn’t be any further, to be honest). And that is when we started experimenting and looking for the levers that could impact monetization and uncover the right product direction we needed to take.
One of the first things we did was running an experiment where we increased all the timers in the game by a fivefold and greatly increased the cost of IAPs for half of our users. Our players were not happy with that decision. This resulted in King of Thieves plummeting to a 2-star store rating. But at the same time, the LTV increased by 2.5 times. Would we have dared to run a similar experiment in the game with millions of users? I don’t think so.
We did a lot of crazy experiments during the soft launch, which helped us understand the product better. In the end we found the levers that had a clear impact on the monetization. By the moment of the global launch the LTV had improved by more than 40 times compared to the first version of the game.
In my opinion, experiments should not be limited to testing new features and measuring their impact. Experiments can also help your team understand their game, see its potential, learn how to affect it and quickly test the directions the game can take.
Making the global launch decision
So, you have soft launched your game. Now you’re trying to improve its key metrics: you release a new version every few weeks, run A/B tests, measure the impact of the product changes. But at what point will your game be ready for a global launch?
Very often, in my experience, the decision to launch globally is based on intuition. Truth be told, there is no single proven way to make this decision. The publisher/developer usually base their launch decision on a hypothesis of the scalability of user acquisition. In my opinion, there are some other elements to consider.
Mobile gaming market is close to what an economist would call a perfectly competitive market (except for some categories). What that means is that if your product is not significantly better than an average product in the same category, there is little chance to get a significant market share. Simply put, there has to be a reason for a player to switch.
Here are some signs that your game is outperforming the market:
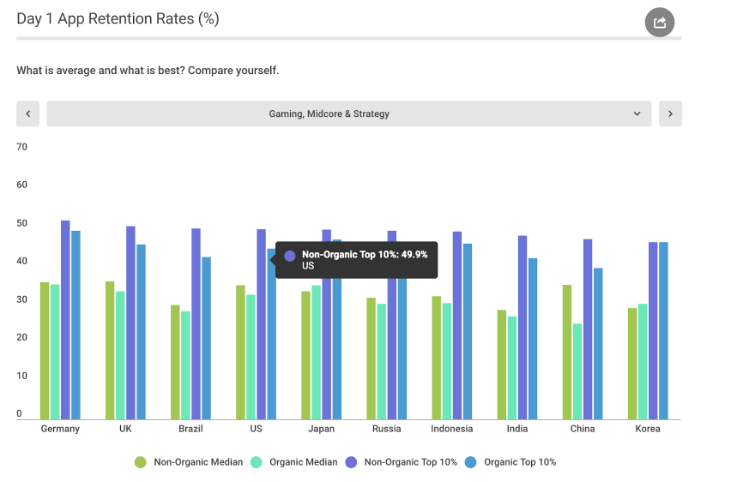
- Your game’s retention is better than the retention of similar titles in the sub-category. You can easily find the benchmarks from various service providers. Here are the ones from the recent report from Appsflyer.
- Your LTV is higher than LTV of other games in your sub-category. This of course means that either you retain users better, or you found a better way to monetize them. You can estimate LTV of competitor games with the help of Sensor Tower or Datamagic.
- You CPI is lower than the competitors’ at least for some segment of audience. That is usually the case when you found an unfulfilled need on the market or more effective way to acquire users.
If things mentioned above fit your game, then most likely you will find distribution channels with ROI > 0. If you target organic traffic sources – you are likely to win the competition because app stores rank apps based on the value they generate. If you outperform your competitors you will eventually get to the top ranking position. Such games are more likely to get featured and supported by the app stores and are more likely to start getting users from word of mouth.
On the other hand, if your game underperforms, it will be difficult for you to get a share of the market. App stores won’t likely feature you either. Put yourself in the shoes of the app store’s product manager who has other apps with reviews and track record that does better than your game – why would she be interested in promoting your game over others?
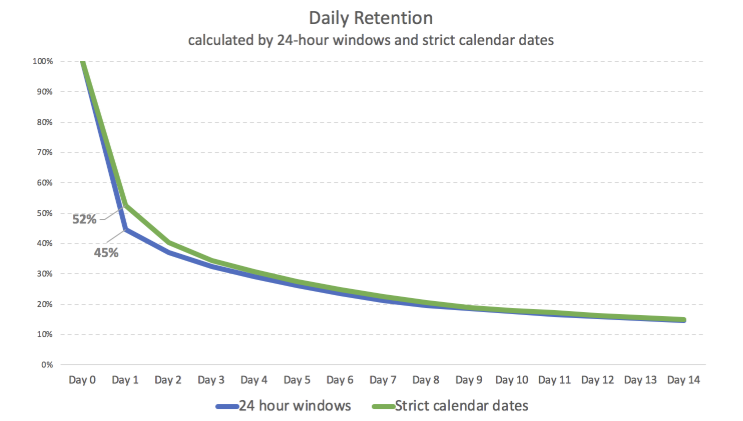
The important thing is to always compare apples to apples. Sometimes people talk about retention rate while what they really mean is rolling retention. Another common misunderstanding is that there are several ways to calculate retention rate: some use calendar dates while others go with 24-hour windows. Amplitude, for instance, calculates retention rates based on 24-hour windows by default, while Apsflyer and some other analytics systems calculate retention based on calendar dates by default.
Here is an example of how big this difference can be when using different ways to calculate retention. On the graph below you can see the same product’s retention calculated based on 24-hour windows and calendar dates. D1 retention equals 52% in one case and 45% in the other. That is a huge difference!
Example on how outperforming competitors impacts the growth
Here is another story about the game we made, Epic Split Truck Simulator. Quickly after the launch the game started getting organic traffic, but there was a specific change that had a dramatic impact on the game’s growth.
At some point we decided to change the app icon and the screenshots. Below you can see the new and old version of the icon (the new one is placed on the left):

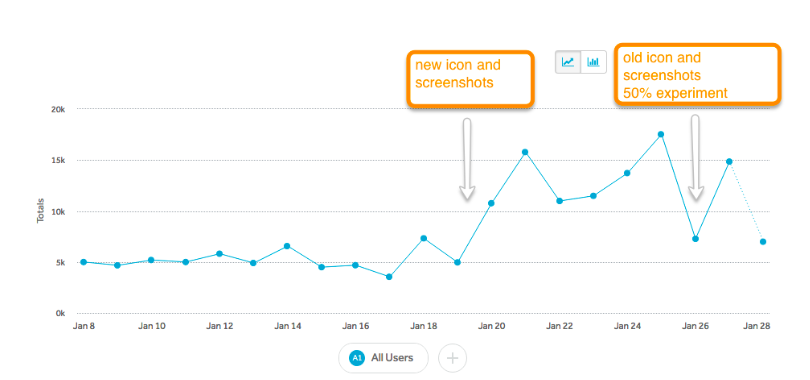
After changing the icon the number of downloads sharply increased by several times: from ~5k to ~15k downloads per day. Few weeks later the game was getting over 30k downloads per day.
Here is what happened:
- On January 20, the team launched a new icon (left) for 100% of users.
After that, the number of downloads increased dramatically (almost threefold), and the team decided to check whether this had anything to do with the new icon or not. - On January 26, the experiment was launched: 50% of the Google Play visitors were presented with the old icon, while the other 50% saw the new one.
- On January 27, the team stopped the experiment because it had a negative effect on the number of downloads.
The number of game downloads by days:
The number of game downloads by hours:
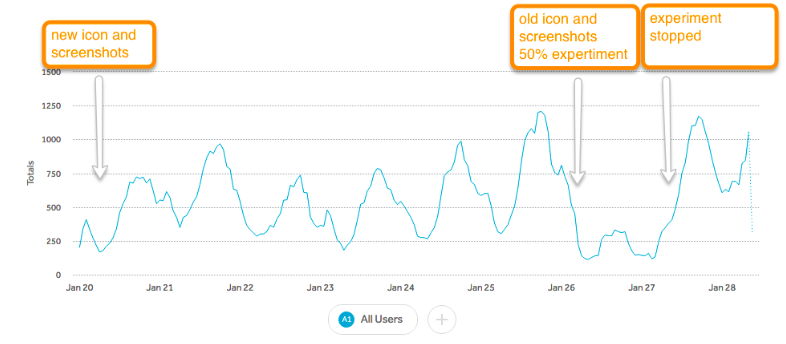
According to the results of the experiment, it turned out that the new icon increased the page conversion rate by ~80%. However, the impact on the number of downloads was significantly greater (+200%). To understand the reasons of this discrepancy, let’s discuss the model of game’s growth and how did the new icon impacted it on different levels.
Most new users were coming organically from Google Play. The main source of traffic was the “Games you might like” section on the main page of the app store. Such recommendations are personalized for each user.
The new icon had a higher CTR, and this had an impact on the acquisition funnel at several levels, which entailed a significantly larger effect:
- CTR (click-through rate) increased in the recommendation block on Google Play’s homepage thanks to the new icon. As a result, more users started visiting the game’s page.
- Page conversion rate also increased.
- Consequently, the improvement of download conversion rate on the main page mirrored that of the previous steps.
- The above factors made Google Play recommend the game to new users more and more often.
Thus, one small change in the icon led to a threefold increase in the number of game downloads. As soon as we changed the icon the overall conversion from impression in the Google Play’s recommendations section into app’s download increased significantly. The game started getting much more organic traffic, and the Play Store started promoting it more.
This story illustrates the importance of having better metrics than your competitors’ and how it impacts the growth and visibility in the app stores. However, the main lesson here is that it is crucial to understand your product model, it’s growth drivers and its key growth loops. This understanding will help you focus your efforts on the most impactful areas.
Monitor key metrics and investigate sudden changes
Time for one more story about King of Thieves. There is a special skill in the game that allows users to increase the gold they steal from other players by a certain amount. For example, if a player has been pumped up with a 10% skill, then stealing 1,000 gold will give him an extra 100 gold pieces. Players receive the additional gold from the dungeons they attack successfully.
Some players considered this unfair and complained a lot. The amounts of gold issued for the bonus weren’t very large, so the team decided to stop applying the penalty to defenders while still giving the attacker the bonus. They thought it would stop all the negative feedback from the community.
The hypothesis was that this should have a positive effect on retention and avoid spoiling monetization. However, the consequences of this small change were disastrous.
There were players who had already accumulated a lot of gold. Earlier, when they were attacked and robbed by other players, everything worked well. Their gold stashes was drained, other players were got rich, and the overall balance was maintained.
The new move disrupted this balance. The wealthy players who got attacked remained rich, and those who robbed got richer as well. As a result, the amount of gold in the game economy began to grow at an uncontrollable pace.
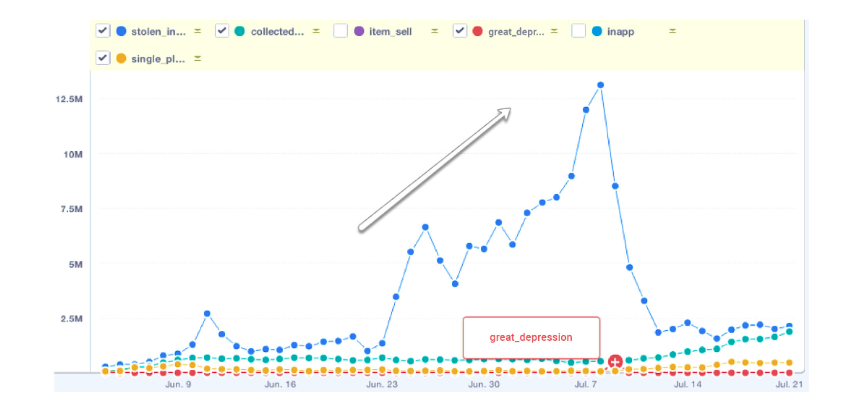
After a few days, the in-game’s prices became meaningless because users had amassed an absurd amount of gold. Retention rates decreased because players lost their interest in the game, and monetization became worse because users had no incentive to make purchases. And the volume of negative feedback, instead of declining, skyrocketed.
We have to remember that games are complex systems. Sometimes even small changes to a part of a product can have unpredictable effects on other parts. To be able to quickly understand what happens and to quickly fix unexpected consequences of product changes, you have to keep a close eye on the metrics visualizing all the key parts of your game. That’s why having thorough and detailed dashboards is crucial.
There is another and more important reason to regularly monitor the key metrics. No day is alike for a live game with tens or hundreds of thousands of daily active players. Every day, something new happens to your game. Today, you’re going viral on the mainstream media; yesterday you changed the keywords for your app in the app store; the day before, the team might have rolled out an update.
Each point on your dashboard’s graphs represents the result of an experiment that the world (sometimes with your help) runs on your product. Each point on your dashboard’s graphs is an opportunity to understand your product and make it better.
I believe you need to become a researcher. Instead of asking the dashboard “Is everything OK?” ask “What caused this spike? Is there something I can learn from?” And at this moment, the changes that you used to interpret as mere accidents will push you to start learning new things about your product and your users.
Keep looking for “spikes.” Get to the very core of where they come from. Many of them be self-explanatory, such as one-off featuring in a specific country, and will hold nothing interesting to explore. But this doesn’t mean you should stop researching. Some “spikes” will be caused by factors you haven’t thought of before, factors that can impact the metrics of your product. And this is exactly what you need to keep an eye for: the levers that will help you grow the product forward.
Incremental Improvements vs. “Bold Beats”
In my opinion, there is one key mistake that many teams make after scaling up their game: they underestimate the importance of consistent improvement of the game through marginal gains at different product levels.
In the early days of working on a new game teams tend to look for big wins that could significantly improve the key metrics. However, If you have done a great job at the soft launch stage, by the time of the global launch you should have already collected key information on what truly moves the needle as well as experimented with some big changes. Thus after the game has been scaled, it’s time to dig deeper and start optimizing key product flows and funnels through rigorous experimentation.
Take this hypothetical example. Say you have five teams (or pods, as they are often called) working on different parts of the game from acquisition, onboarding, engagement, retention and monetization. Each team launches 10 experiments over a quarter. Four out of five experiments fails to deliver any positive impact. One out of five experiments proves successful bringing small improvements of 2% to 3% lift to a key KPI. Each improvement is small and doesn’t visibly affect overall metrics of the game. Yet if you combine all these tiny wins over several quarters, you will see a clear upward pointing trendline in the game’s performance which translates into a healthy and sustainable growth. In this particular hypothetical example there would be 10 successful experiments over a quarter. All of the improvements would be small but combined together they would increase the key metric by almost 30%.
Focus on incremental improvements does not mean that you should avoid bigger changes, which bring completely new elements and experiences to your game. This “bold beats” as they are often referred to need to have a prominent placement in the product roadmap and I merely advocate for the balance between low cost incremental improvements and much more demanding additional features.
Think of the first version of the iPhone and what it has become now. In many ways, the iPhone’s huge success was achieved due to the consistent improvement of the key systems of the device, like its camera, processor and battery. Such progress usually doesn’t happen due to some sudden successful leap forward. It happens because of the cumulative effect of dozens or even hundreds of small improvements made at different product levels year after year.
Keeping focus on constant incremental improvements requires a data-driven culture and an experimental infrastructure that will make it easy for any of the teams (or pods) to launch experiments and measure the impact of these experiments to the product’s key metrics.
As another example, here’s the description of Uber’s experimentation platform. It truly shows how data driven Uber is. Improving their product constantly is something Uber has to do to stay ahead of its agile and hungry competition. And while the competitors of Uber are very aggressive and motivated, I think the competition in mobile games is far more aggressive to the point where not being data-driven is a path to mediocrity at best.
Rapid and Constant Beats the Race
There are many ways how data can increase your chances of building and operating a successful mobile game. The key is to stop thinking of data as a way to look back at what you have done, but instead start using data as a tool that can help you make decisions, decrease uncertainty and remove main product risks as early as possible.
Experiment often and experiment early – even before you actually start the development. And never underestimate the importance of consistently improving the product through marginal gains. The quality of such work is the factor that often separates the best products from those that lag behind.
→ Test your product management and data skills with this free Growth Skills Assessment Test.
→ Learn data-driven product management in Simulator by GoPractice.
→ Learn growth and realize the maximum potential of your product in Product Growth Simulator.
→ Learn to apply generative AI to create products and automate processes in Generative AI for Product Managers – Mini Simulator.
→ Learn AI/ML through practice by completing four projects around the most common AI problems in AI/ML Simulator for Product Managers.


