
In May 2023 we launched the SQL Simulator for Product Analytics. The team of creators who authored the simulator—Eugene Zhulkov, Oleg Ya, and Osman Ramazanov—share details about how they discovered the need for a purpose-built SQL course for product and marketing-adjacent people. While creating the new educational product from scratch, they discovered and overcame several challenges.
Drawing inspiration
Three years ago, GoPractice’s first and only educational product was the Data-driven Product Management Simulator. That simulator covers product management at the early stages, from the initial idea to achieving product/market fit.
The simulator does more than just educate. It has brought together students to create a product community for which we work hard to consistently offer value. This planted the seed for creating additional educational products. But before making new products, we wanted to know what skillsets were most in demand by our students?
Surveys showed that the most in-demand topics were Python and SQL, as well as product growth management (which we will come back to a bit later).
The problem with Python was hype. It is the most popular programming language in the world. But we felt that it’s much less relevant to product work than other languages like SQL.
SQL, if anything, is underhyped. Not knowing it can impact the ability of product and marketing people to do their jobs, because they are forced to constantly refer to data analysts for the simplest queries. This is a drain on the time of everyone involved.
Make sure to read our material on why SQL is one of the top skills for product managers. We asked seasoned product managers to share their experience with using SQL in their daily work.
To use your SQL knowledge in practice, you need the skillset that helps you solve product challenges in the real world.
That’s why we decided from the get-go to avoid generic and imaginary exercises in the course. Instead, we concentrated on real-life situations that borrow heavily from the reality of product and marketing work. We recorded dozens of cases from discussions with our students of how SQL could have helped them. We then analyzed them and selected several that would be suitable to explore in detail in the simulator.
We pinpointed the tasks that forced our students to ask colleagues for help. We also looked at the analytics tools they wanted to learn and tasks they wanted to use them for. We asked for examples of real tasks that our students had recently encountered and details of how they attempted to solve them without SQL. Then we carefully analyzed every case, selecting the ones with the highest relevance and priority. These eventually formed the core of the simulator.
The thing about many existing courses is that they teach only SQL syntax, with examples that are far removed from the “ground truth” of product work. In the real world, solving practical tasks requires figuring out where and how the data is stored, what the quirks of the data are, and how to clean it up to make it usable. Knowing syntax is just a tiny piece of the larger puzzle. Syntax is nice, but that’s not enough to calculate retention or LTV with SQL. To make decisions, you must also know where these metrics come from and how their calculation works.
Oleg Ya
It’s a bit like driving. Even if you know all the traffic rules and ace the written test, you’ll never learn how to drive until you’ve actually spent time behind the wheel.
So much data
The centerpiece, which required the lion’s share of effort from us, was the dataset. After considering several ideas, we decided that the dataset for an online marketplace would be the best material for illustrating the tasks enumerated during the previous stage.
Why a marketplace? This type of dataset has a wide range of data: buyers, sellers, products, and categories. This shows the complexity (and perhaps perplexity) involved in working with a real product.
Moreover, the marketplace provides enormous possibilities for both product and business analytics. (It also helped that Oleg has experience at a company where he helped to develop an international marketplace.)
Using this dataset, students can learn:
- Where data “lives”, and in what form
- How to analyze data
- How to clean up data
- How to verify results
- How to answer questions using the available tools, even without knowing how to write an ideal query
- How to calculate product metrics
Crafting out the dataset took several months. The revisions stretched the process to over a year. Every iteration of data generation took dozens of hours, with many factors needing to be considered.
You have a marketplace and a user has just signed up. What is the traffic source for that user? Which country are they in? What did they buy? When did they buy it? How much did they pay for it? When did they return to the product? The questions are endless—and this is just one of tens of thousands of users.
Then you need to add information about merchants, products, when these merchants and products appeared on the marketplace, and who made purchases. All this data needs to be plausible, internally consistent, and reflect how actual marketplaces work. For example, when a user buys a product, the product should be in stock for the merchant at that particular moment in time. You have to consider the story, hidden interrelationships, and logic in the data.
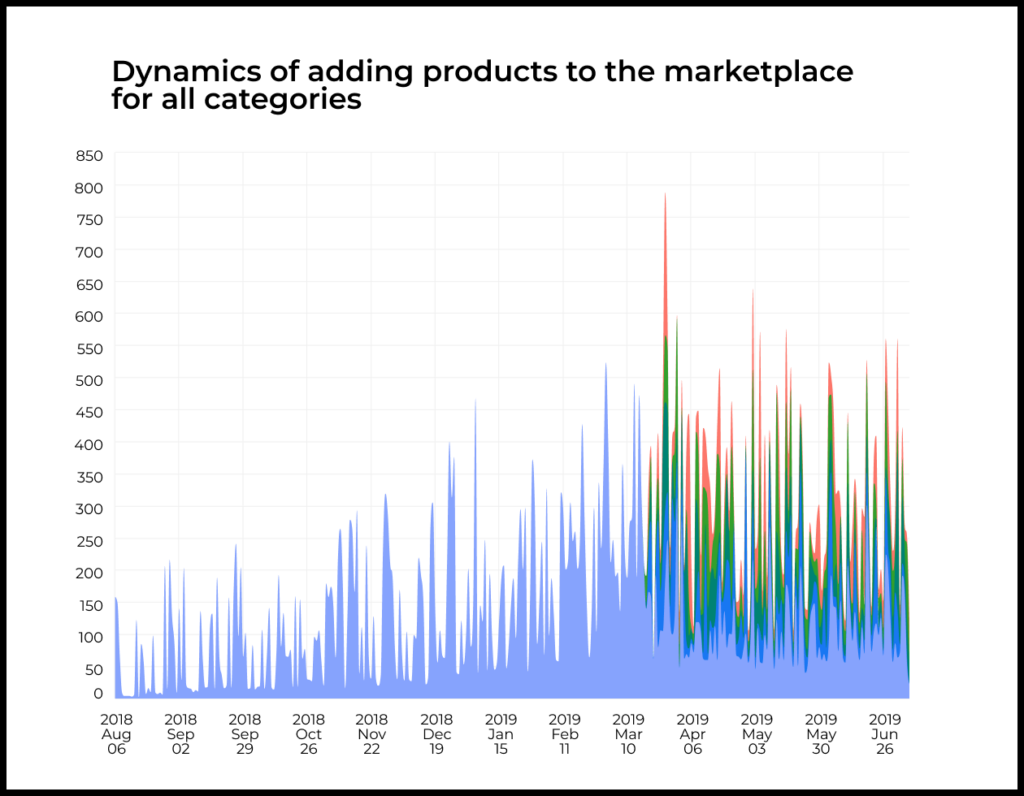
We even included seasonality. User retention varies based on day of the week, month, and season. User activity depends on time of day.
We made the dataset as realistic as possible by intentionally adding gaps, duplicates, non-existent users, and other “glitches” that students should learn to handle. Almost any real-life database will contain these issues. So it’s better to learn early on about potential solutions and workarounds.
Designing and arranging the material
The hardest part of the process was designing the structure of the chapters. We worked to split up broad topics and questions into logical chunks, adjust pacing, and intersperse harder chapters with simpler ones.
The pace of assignments, complexity of chapters, and chapter type change throughout the simulator. Some of the chapters are heavy on explanations, while others are almost entirely hands-on.
The difficulty of the chapters also varies, similar to F2P mobile games, in which the difficulty of levels alternates between simple, hard, and then simple again. Conquering difficult assignments gives a feeling of satisfaction. Completing simpler ones gives the chance to relax and recharge.
Eugene Zhulkov
Our main consideration in designing the chapter flow was to help understand how SQL tables are structured and how to choose the query that can produce the desired results.
The course especially “rushes” students by increasing the difficulty of exercises slightly faster than introducing new tools to solve them. This way, students will attempt to use the old toolset they already know, finding solutions that work but are clunky and inefficient. Once they’ve experienced this, they are then presented with new tools that provide a more elegant way of accomplishing that task. Students should walk away with an understanding that any task can be solved in different ways, but with an intuitive feeling of which functions or operators are best suited for a particular situation.
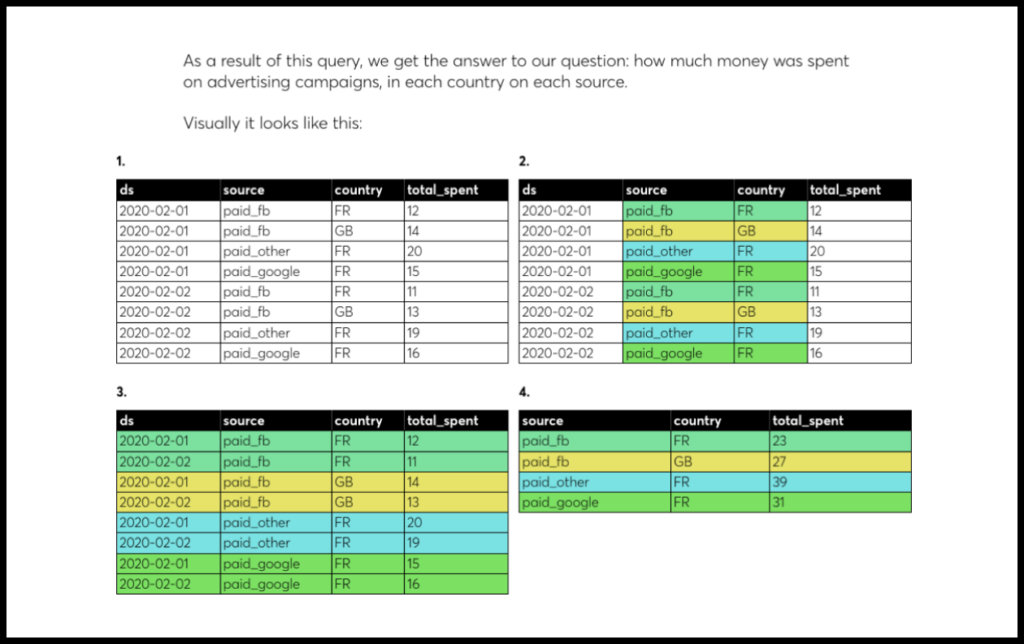
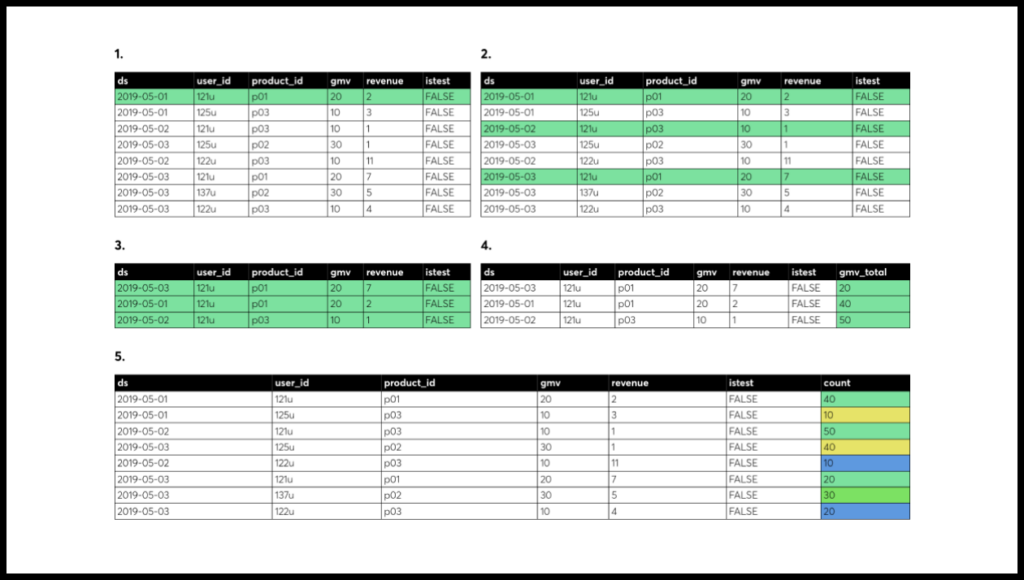
We also show step-by-step flows of how a query operates on a table. This helps people to visualize what each part of a query does in a way that is interesting and easy to remember.
We workshopped the earliest versions of the simulator in Google Docs and Zeppelin with test groups. The chapter structure was constantly evolving and we rolled up our sleeves to participate in the learning process personally.
As we refined our notions of how to deliver new knowledge and skills to students, the simulator began to truly take shape.
How the SQL and growth simulators influenced each other
Before starting work on the SQL simulator, we ran a survey that showed our audience was interested in how to grow and scale a product that already had proven value. This topic is in many ways more complex and multifaceted than that of the first GoPractice simulator.
After putting enormous effort and resources to create the stories and dataset for the SQL simulator, we decided to combine these two efforts and integrate the material for the SQL simulator with our personal experience into what eventually became the Product Growth Simulator.
Our logic was: the first simulator taught product management in tandem with analytics in Amplitude, so why not have the second simulator also incorporate analytics, namely SQL, for the student to study in parallel with theory?
We tried to shoehorn SQL—a tool that is admittedly more complicated than Amplitude—into learning the main subject. But this effectively complicated learning the actual subject matter. SQL wasn’t relevant to all students, since senior specialists either didn’t have any real need for it or already knew enough about it. But learning SQL took up a lot of time and detracted from our focus on product growth.
We realized that there was no way to resolve this conflict within a single product. It started coming apart and users indicated that they had been hoping to obtain more insights, given their significant time investment.
Oleg Ya
It became clear that learning SQL and learning to manage product growth were two distinct objectives that spoke to different segments of our audience. So we decided to spin off the SQL Simulator for Product Analytics into a separate product.
SQL still occupies an important place in the growth simulator, where it enables students to independently slice and dice data. But it’s not relevant or a high priority for some students. So we decided to make SQL optional. In the growth simulator, students always have the option of using prepared queries to get and analyze the information they need without the need to know SQL.
It was feedback from our test cohorts that helped us to decide to split the simulators into separate products. Testing and discussions with students showed a way to eliminate many minor issues and restructure the simulator to deliver knowledge and skills to students in a more compelling way.
What made (and didn’t make) the cut, and why
The goal of the new simulator was to teach SQL in a way that can help in solving typical tasks related to product and marketing. We got input from experts and the students themselves as they applied the lessons in practice and shared the challenges they encountered in their work. We then repeated this process several times.
We made sure the simulator included the most commonly requested calculations, including:
- Retention curves
- High-level metrics (DAU/WAU/MAU)
- New users, sales, and profits
- LTV and user segmentation
- ROI for acquisition channels
Feedback inspired us to add assignments involving window functions. This is a more sophisticated approach that offers a simpler way to calculate many important metrics. It helps with moving averages, running totals, report generation, and many other tasks where you need to perform calculations on a set of rows.
Talking with students also influenced our design of the course’s final assignment—a case that draws on all of the newly acquired SQL knowledge. The student has all the knowledge necessary to answer a sophisticated question about the impact of changes on a product.
Osman Ramazanov
Just as important were the decisions about what not to cover. For example, we did not include manipulating data with SQL. The course has nothing about deleting, editing, or adding data or creating tables. This is certainly an important part of SQL but we think it is much less relevant to product people, marketing people, and even analysts, given that programmers are usually the ones responsible for data integrity and minimizing manual edits.
Results
How much do we have to be proud of? The simulator contains:
- 4.5 million records about marketplace users
- 130,000 records about merchants, with 8 million related product entries
- Tens of millions of records about things such as product views and user purchases
- A database totalling 15 gigabytes
Here is what students have to say about the SQL simulator:
The live simulator approach was the perfect learning medium for picking up a new skill, and the format of short but impactful chapters makes it really fun & easy to progress quickly.
Finn Hefferon, Head of Product, Stake
Instead of drowning in millions of resources on the internet, we can get 80% of the required knowledge in DB for analysis via GP’s SQL simulator!
Naveen Kumar Sundaramoorthy, Senior Product Analyst, Open Weaver
I really liked the simulator as it helped me to understand better how the data is queried, and now I can work better in a fast-paced environment with my data analytics colleagues.
Ivan Krešimir, Product Manager, Happening