
Day 1 retention of 65%!
A mobile game with that kind of retention must be something special, right?
But wait. Metrics can mislead. Teams might use the same name even when they mean different things.
→ Test your product management and data skills with this free Growth Skills Assessment Test.
→ Learn data-driven product management in Simulator by GoPractice.
→ Learn growth and realize the maximum potential of your product in Product Growth Simulator.
→ Learn to apply generative AI to create products and automate processes in Generative AI for Product Managers – Mini Simulator.
→ Learn AI/ML through practice by completing four projects around the most common AI problems in AI/ML Simulator for Product Managers.
Story time.
I used to work for game developer Zeptolab.
A small studio reached out to us to publish their new game.
We looked at their metrics: Day 1 retention exceeding 65% and Day 7 retention of 35%.
We were impressed. For a game of its genre, these numbers were phenomenal.
But after trying out the game, we found nothing special about it.
And only a few weeks later did we discover that the “retention” they used was actually rolling retention.
The team just looked it up in their analytics platform and quoted these numbers without bothering to check how they were calculated.
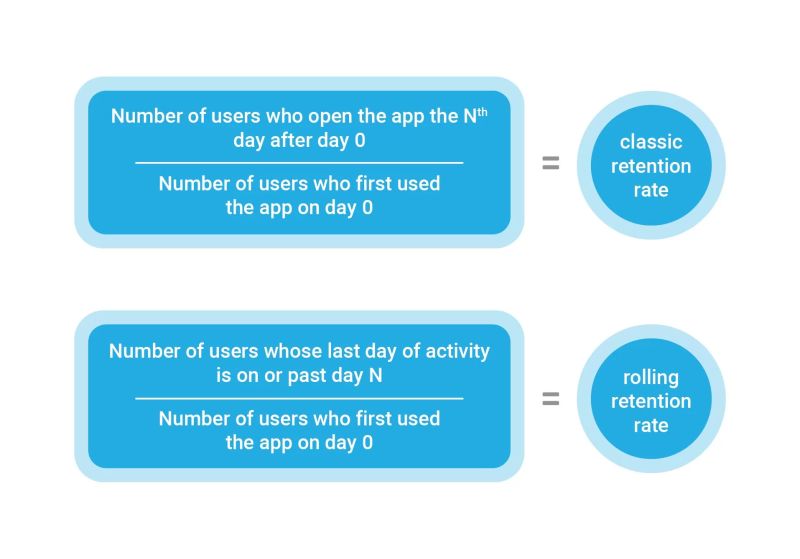
The difference was a meaningful one:
- “Day N retention” means the percentage of users returning to the app on a specified day after their first launch.
- “Rolling retention” means the percentage of users who return to the app on a specified day or (this is the kicker) on any day after that.
Whenever you see a metric, find out how it was calculated.
Similarly, when giving a metric, always explain what you have in mind.