
LTV (Lifetime Value) is an important metric for decision-making in both marketing and product management. But measuring LTV is a bit tricky and you can easily make mistakes when calculating it. Moreover, even articles that have found their way to the first page of Google search results contain mistakes when it comes to calculating LTV.
In this essay, I will discuss how to (not) calculate LTV, and how to avoid these common mistakes:
- Calculating LTV based on revenue instead of gross profit.
- Calculating LTV by using users’ Lifetime which is calculated as 1/churn or in any other way.
- Calculating LTV based on the average number of user purchases.
→ Test your product management and data skills with this free Growth Skills Assessment Test.
→ Learn data-driven product management in Simulator by GoPractice.
→ Learn growth and realize the maximum potential of your product in Product Growth Simulator.
→ Learn to apply generative AI to create products and automate processes in Generative AI for Product Managers – Mini Simulator.
→ Learn AI/ML through practice by completing four projects around the most common AI problems in AI/ML Simulator for Product Managers.
What is LTV (Lifetime Value)
The classic definition of LTV (Lifetime Value) is the gross profit an average user brings over the entire period of using a product.
In practice, LTV is usually calculated over a specified period after the user starts using the product, e.g., X days or months. For example, LTV for day 7 or LTV for month 12
The choice of the calculation period depends on the tasks one is trying to solve. For example, if a marketing team acquires users from ad networks and expects to recoup the investment in one year, then the one-year LTV will be crucial for them.
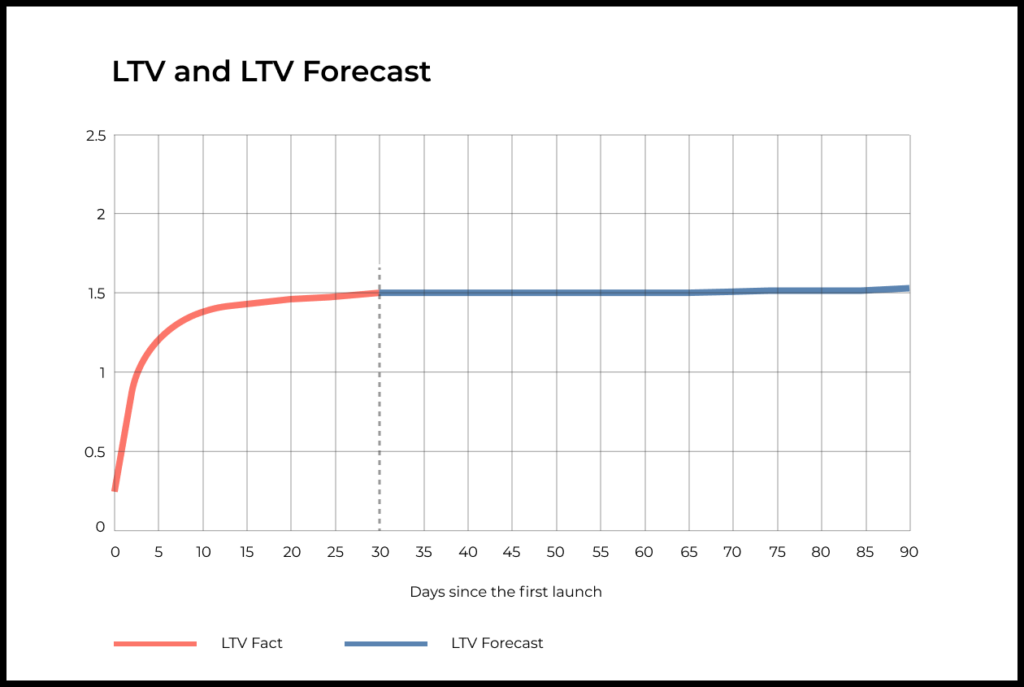
If we calculate LTV by say Day 0, 1, 2 and further on, then we will get an LTV curve in dynamics. The graph of LTV dynamics by day usually looks like this:
How to calculate LTV
Basics of calculating LTV in a nutshell.
We calculate LTV based on:
- Gross profit
- Cohort analysis
- In practice, you should be able to predict LTV based on a few days of data collected from a new cohort.
Let’s take a closer look at each of the points above.
LTV is calculated based on gross profit, not revenue
Gross profit is the difference between a product’s revenue and all the variable costs that are directly associated with the product or service (COGS).
Here’s a simple rule of thumb for determining which expenses should be deducted from revenue when calculating the gross profit:
- If expenses increase linearly with sales and revenue, then they must be deducted from the revenue.
- If certain expenses do not increase as sales volumes grow, then they do not need to be deducted.
If your product is a mobile game in the App Store, then in order to calculate a gross profit from the amount of money paid by your users, you will need to deduct the Apple commission, the support team’s costs (salaries, software and other expenses). Meanwhile, you don’t need to deduce salaries for the development team. These are fixed costs, they do not grow in proportion to the game’s revenue.
If you are selling masks through an online store, then to calculate the gross profit, you will need to subtract the cost of masks, the shipping costs, the payment solution provider fees and other costs directly associated with the sale’s process.
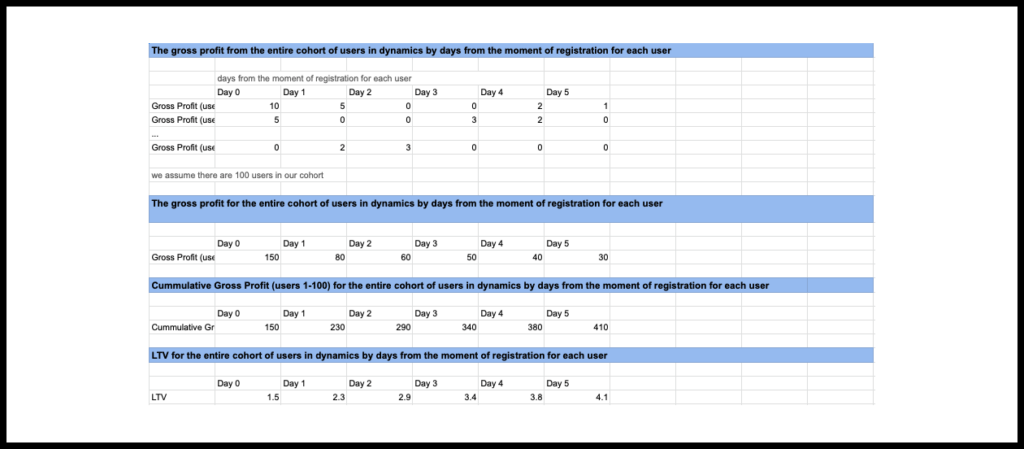
How to calculate LTV with the help of cohort analysis:
- We take a cohort of users and we calculate the gross profit for each user in dynamics by day from the moment of registration.
- We calculate the gross profit for the entire cohort of users in dynamics by days from the moment of registration for each user.
- Based on the previous result, we calculate the cumulative gross profit of the user cohort in dynamics by day. The gross profit for day N will be equal to the gross profit for day 0 to N.
- We divide the cumulative gross profit by the number of users in the cohort and get the daily LTV dynamics of the user cohort.
An example of calculating LTV in Google Spreadsheets
Predicting LTV
A marketing team that expects to recoup the costs of paid traffic in one year cannot wait the entire year to decide whether their ad campaign is worth continuing or not.
The decision must be made much earlier than the data for calculating the actual value of LTV over the first 12 months becomes available. Therefore, it is important to be able to predict LTV based on several days’ worth of data collected from a new cohort of users.
In my experience, most teams quickly develop a set of simple rules (heuristics) that allow them to make such decisions. Based on the historical data, they can estimate what the ROI (or LTV) value should be for day 1, day 2 and the following days to achieve their goal. If a new ad campaign doesn’t meet these values, then they discontinue it. If the campaign results match or exceed the expected level, then the team continues running this campaign or scales it.
This approach won’t provide an ideal forecast, but it helps make decisions. Usually, as budgets grow, teams introduce more precise rules—often specific to some segments of users—based on countries, operating systems, and other factors. Many companies also develop more advanced tools and models for predicting LTV.
The wrong way to calculate LTV
LTV should not be calculated based on Revenue
If you Google “How to calculate LTV”, several of the top results will likely suggest calculating LTV based on Revenue.
For some digital products with zero marginal costs, revenue and gross profit can be very close to each other. But in many products (Uber, Dropbox, Joom / Aliexpress), there will be a significant difference between gross profit and revenue. In this case, calculating LTV based on revenue can be costly for the company. The marketing team will confidently scale ad campaigns that actually generate losses, not profits.
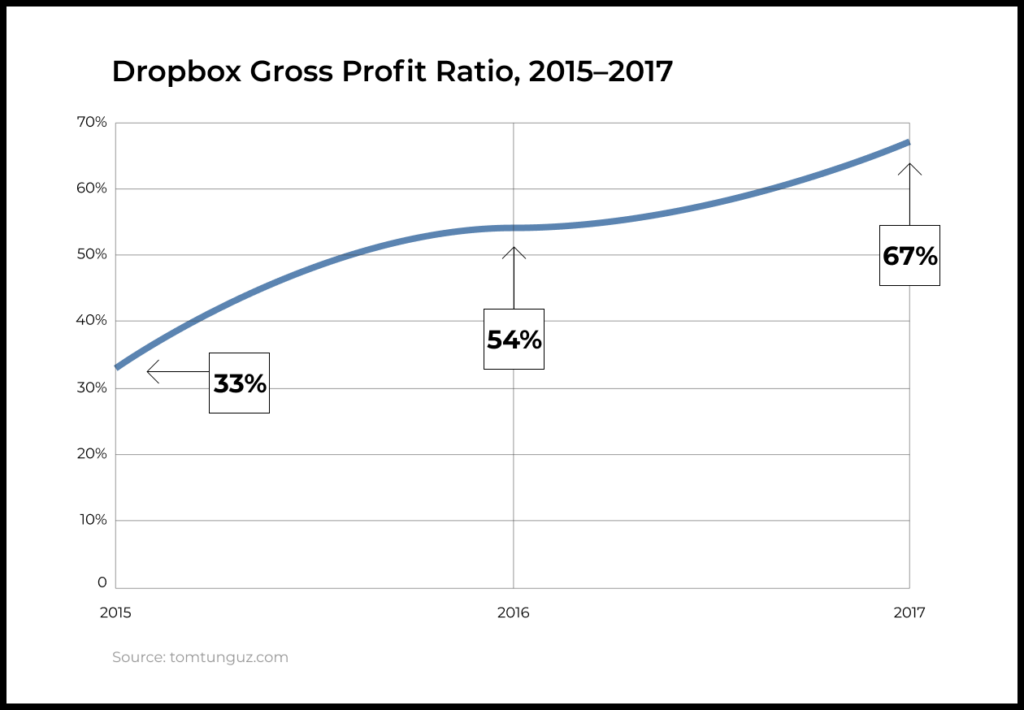
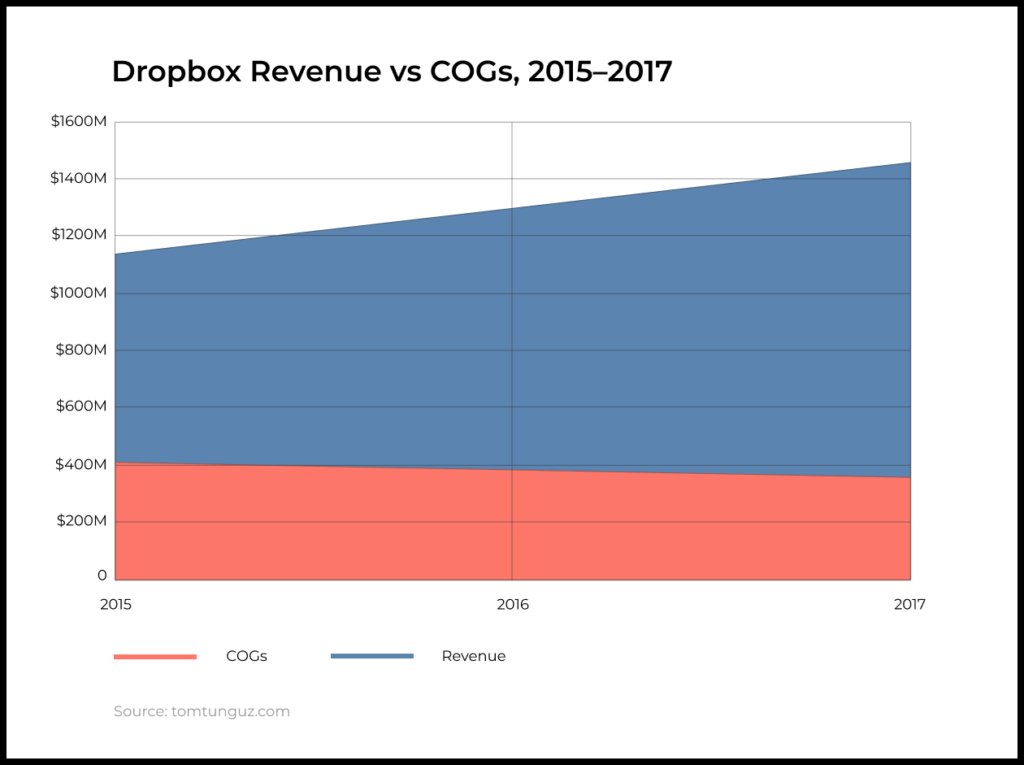
For example, Dropbox has significant expenses to cover the costs of transferring and storing users’ data on its servers. In this case, calculating LTV based on Revenue would be misleading for the team.
The graph below shows the revenue and cost of revenue Dropbox. In 2015, for example, the company spent 67% of its revenue to provide the services to users (file storage, internet traffic costs, commissions to payment systems, and so on). Over the two years that followed, Dropbox was able to dramatically improve the margins of its business.
You shouldn’t calculate LTV based on user lifetime
Here’s another common and incorrect method for calculating LTV:
LTV = ARPU x Lifetime
There are two problems with this LTV formula:
Firstly, ARPU is calculated based on Revenue. We already discussed why LTV should be calculated based on Gross Profit.
Secondly, this formula suggests multiplying ARPU by the “mythical” Lifetime indicator, which equals the user’s lifetime in the product.
Different essays suggest different ways of calculating the lifetime of a user in a product. Let’s discuss the most popular ones.
Lifetime as an average of the number of days between the time users install a product and when they stop using it.
- Calculating lifetime this way can produce some strange results. For instance, the user could have launched the app for the first time, used it the next time in 30 days, and left on the next day. According to the calculation method mentioned above, the user had a 30-day lifetime. But in reality, the user was only in the product for two days.
- Another problem with this approach is that it doesn’t determine what to do with users who are still using the product.
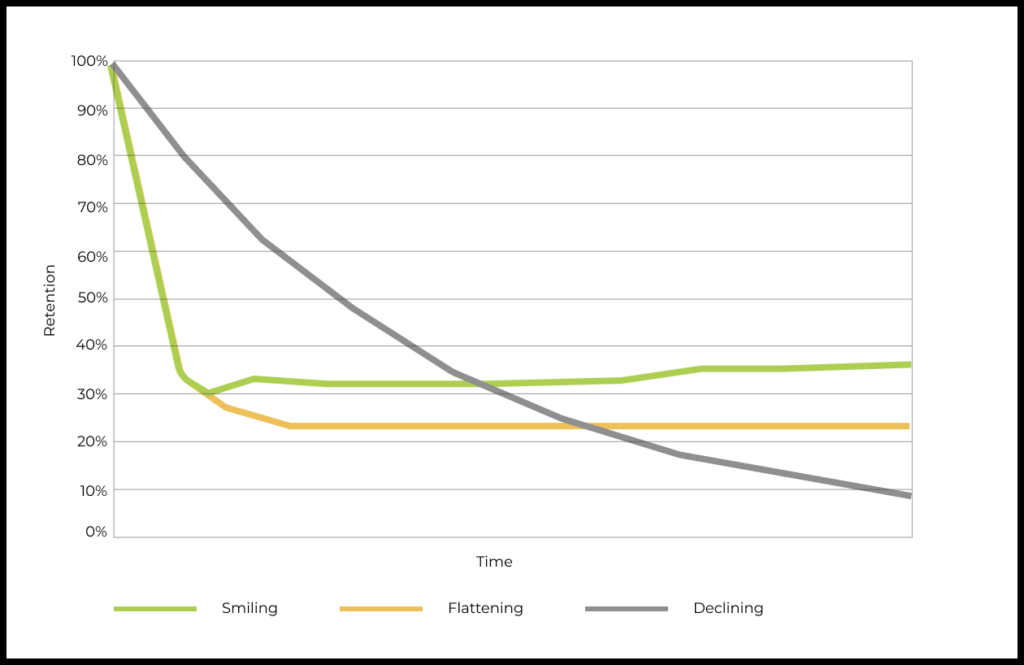
- Another approach suggests calculating Lifetime as the area under the Retention Curve. This makes more sense than the previous method but still has some problems:
- At what point should we calculate the area under the curve? For a number of products, retention curve plateaus (for example, Facebook or Youtube), which means new users turn into regular ones. What shall we do in this case?
- Let’s say we calculate the area under the curve by day 1, by 2, and so on to get the LTV dynamics when multiplied by ARPU. But the ARPU of users on the first day after the install will differ from the ARPU of users for 20 days after the app’s install. If you calculate the “average” ARPU, you will get weird results.
Some suggest calculating Lifetime based on the following formula: 1 / Churn (user churn rate). This approach also has many issues:
- For products that don’t have a subscription-based revenue model, it is almost impossible to unambiguously determine when the user leaves the product.
- This is not easy for subscription products either. For example, a customer might not renew her subscription because she didn’t have money in her bank account. But the next month, she returns and makes the next payment. Or maybe a customer unsubscribes, and then subscribes again two months later .
- Another problem with this approach is that the rate at which users leave the product is directly related to their lifespan. New users leave faster than old ones do. If you look at the Retention curve of any product, the rate of its decline in the first days will be much higher. Therefore, the churn-rate (even if you manage to define it) will strongly depend on the distribution of the user lifespan in the cohort.
Other formulas to avoid when calculating LTV
In essays that discuss LTV calculation, you will find many other methods and formulas on how you shouldn’t calculate LTV. These include methods based on the average number of purchases per user and the average order value, other formulas with complex integrals, and so on.
Summing it up
The correct way to calculate LTV
- LTV should be calculated based on the gross profit.
- LTV should be calculated using cohort analysis.
- LTV is usually calculated by a specific point in time since users joined the product.
- It is practically impossible to wait for the actual LTV values for 12 months, therefore it is important to be able to make an LTV forecast based on a few days’ worth of data and refine the model as more data is collected.
- LTV forecasting can be done using simple heuristics or more complex models that take into account many different factors.
How not to calculate LTV:
- Based on Revenue and its derivatives: ARPU, average check, etc.
- Based on Lifetime. This is a very questionable metric that lacks clear physical meaning and a concrete calculation method.