
When conducting experiments, teams usually include all the active users in their tests, or sometimes they tend to add all the new users who join the app during this test. So when calculating the metrics for different test groups, all the data from the moment the A/B test kicks off is taken into account.
Today I’ll talk about how you can reduce the time required to get the signal on the change you are testing in a product. You can do that by changing the process of adding users to the A/B test, and in this essay I will show you how you can do it.
→ Test your product management and data skills with this free Growth Skills Assessment Test.
→ Learn data-driven product management in Simulator by GoPractice.
→ Learn growth and realize the maximum potential of your product in Product Growth Simulator.
→ Learn to apply generative AI to create products and automate processes in Generative AI for Product Managers – Mini Simulator.
→ Learn AI/ML through practice by completing four projects around the most common AI problems in AI/ML Simulator for Product Managers.
Two approaches towards designing an A / B test
Let’s start with an example.
You’ve noticed that some app users abandon their purchase during checkout. The hypothesis is that with the help of a series of push notifications (reminders, testimonials from other customers, payment plans, etc.), we can convince some of the churned users to complete the purchase, which will have a positive impact on the app monetization.
The standard way to test a hypothesis using an A/B test is as follows:
- Add all the active users to the A/B test and randomly split them into two groups (test and control).
- In the test group, enable the push-notification logic we talked about earlier. The control group’s experience remains the same as before.
- Measure the impact on the key metrics by comparing the performance of the two groups.
Here is the recommended way to validate a hypothesis using an A/B test:
- Make sure to add users to the A/B test only at the point where we are going to change their experience in the product, i.e. send a push notification from the tested campaign for the first time.
- Send a series of push notifications to the users from the test group; don’t send any notifications to the users from the control group.
- Measure the impact on the key metrics by comparing the performance of the two groups.
The recommended experiment design involves two changes:
- Make sure to add only those users to the test group who could experience the change in the product (we say “could” since we change the experience only for 50% of these users who will be randomly assigned to the test group).
- When analyzing the results of the test, make sure to look at the data for these users only from the moment we added them to the test, and not from the moment we started the experiment.
An experiment designed according to these rules will require significantly less time to identify the effect of the change, if any. Let’s find out why.
Make sure to add to your A/B test only those users who could feel the difference while using the product
Say you started an A/B test on April 1 and finished it on April 30.
Below you will find the metrics of the two test groups, if we assume that we are adding all the active users to this experiment.
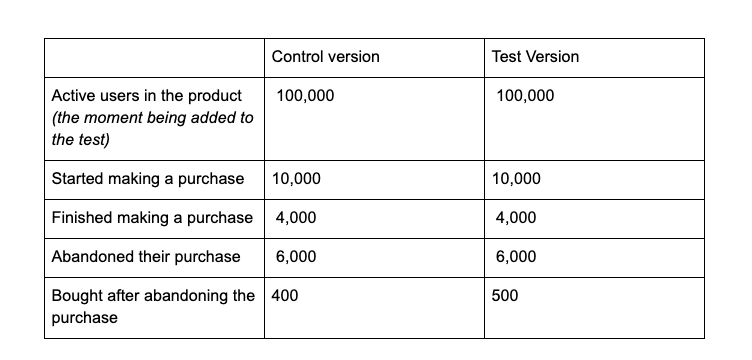
The target metric in the experiment is the purchase conversion rate (the proportion of users in the groups who made a purchase).
- Purchase conversion rate in the control group will be 4.4% (4,000 + 400 / 100,000).
- Purchase conversion rate in the test group it will be 4.5% (4,000 + 500 / 100,000).
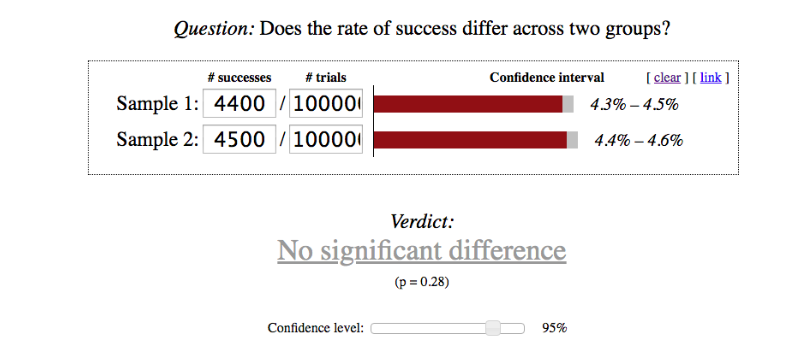
- There is no statistically significant difference (you can check it here). P-value = 28%. This means that there is a high probability that the observed change is accidental.
Now imagine that we added to the experiment only those who could get some new experience while using the product. And those are the users who abandoned their shopping cart while making a purchase.
In this case, the metrics in the test and control versions will look like this:
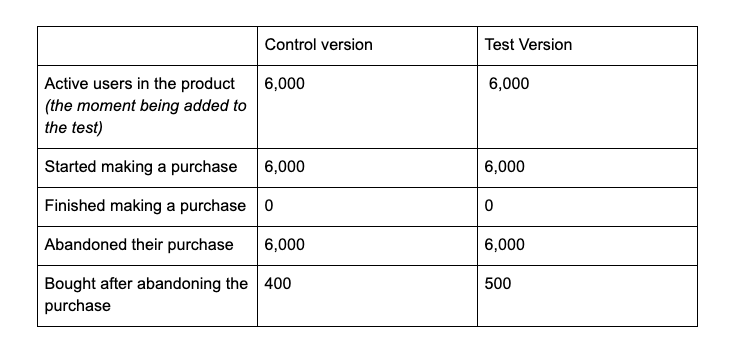
* We only add those users to the test who abandoned their purchase, which in this case means the number of active users and the number of users who started the purchase will be equal to the number of those who abandoned their purchases.
Let’s calculate how changing the way of adding users to the test affected the conversion rate:
- Purchase conversion for users who have become part of the experiment will be 6.6% (400 / 6,000) in the control group and 8.3% (500 / 6,000) in the test group.
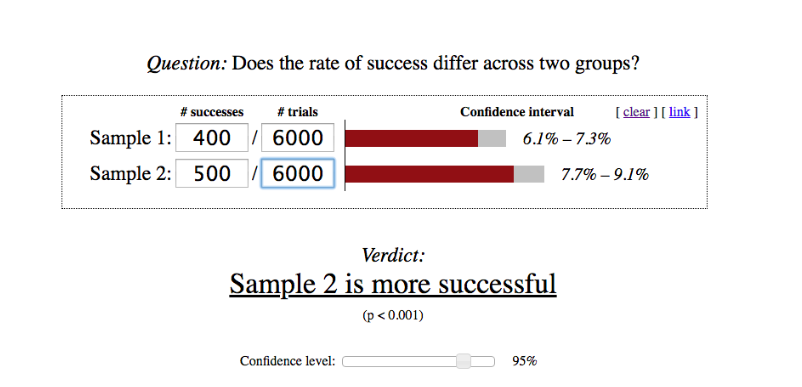
- This difference is statistically significant; even a smaller sample would have been enough to spot the effect of the change made.
When you populate the experiment with users whose experience is not different in test and control groups, you create noise in the data. It makes it harder to notice the signal that comes from users who have experienced the change we made. If the key metric is greatly influenced by the users with a similar experience, then it will take you much longer to identify the effect.
To draw an analogy, think of testing a drug. Let’s assume that for some reason, we add to the experiment not only people with the disease the drug is supposed to cure, but also people who are healthy. If we compare the proportion of healthy people in each of the groups after applying the drug, then healthy people will blur the drug effectiveness metrics intended to be tested on people who are sick.
In the example with the abandoned purchases, the users who immediately made the purchase will have a more significant impact on the test results than those who abandoned their purchase. At the same time, the changes we are testing have no influence on the users who made a purchase right away. Adding these users to the test will blur the effect that the changes will have on the real target of the test (the users who abandoned the purchase). As a result, it will take us much longer to observe the effect of the change we’ve made.
One technical issue is worth noting here. You can add all the users you have to the A/B test, and then analyze only those who could have experienced something new in the product. You can do that, but in most cases it will require some manual work afterwards. If you somehow automate the analyzing part of your test, it is better to only include users who will have a new experience.
Use data only from the moment when users were added to the test
There is another way to blur the effect of the change you are testing. It happens when you take into account all the data from the moment when A/B test starts. To avoid this effect, you should only add data from the moment when each specific user becomes part of your test.
Most users spot something new in the product not at the moment when you start the test, but a bit later. You add extra noise to your data if you consider the time between starting the test and the moment the user becomes a part of it.
Here’s an example: You started the A/B test on April 1st. User X abandoned the purchase on April 10 and at this moment became a part of your experiment. It will be correct to consider data for this user only from April 10 when you will be calculating the metrics. The data obtained between April 1 and 10 doesn’t demonstrate the influence of the tested change on this user because her experience didn’t change during this period.
In the example above, adding such data will not affect the conversion to purchase rate, but it may well affect other metrics.
How to understand the overall effect of a change made
The described approach of adding users to experiments reduces the time required to identify the possible effect of the changes made to your product. However, it slightly complicates the interpretation of the results, since in most cases everyone is interested in the effect of the change made on the whole product.
When you add only a part of our users to the test, the obtained changes in the metrics characterize the impact of the new feature on this group of users only. To understand how the whole product is affected, you need to make a series of calculations.
In the experiment described above, the increase in the number of users who made a purchase was 20% (remember, the experiment was designed in a way so that you only added users who abandoned the purchase to the A/B test). Let’s calculate what the overall impact on the metrics.
In the test group the users made 500 purchases after abandoning their previous shopping carts. In the control group the result was 400. If we consider the entire user base during the experiment, then there were 4,000 more users who made purchases right away in each group.
As a result, a 20% increase in the conversion of users abandoning their purchases translates to a 2% increase in the purchase conversion rate of the entire product (4,500 / 4,400 – 1 = 2%).
How to log the data about A/B test
If you have your own infrastructure for experimentation, then feel free to simply create a table where you will store the information for each of the tests in the following way:
- User
- Experiment
- Group (control/test)
- Date and time added to the test
When you have this data handy, it won’t be difficult to calculate the metrics for the test and control groups in respect to the principles we’ve described above.
If you are using Amplitude or Mixpanel analytics software, you can add a property to the user with the name of the experiment and the test group’s title at the moment when this user becomes a part of the experiment. During your future analysis, you will simply need to filter events according to these properties.