
Retention (also referred to as “retention rate” or “RR”) is one of any product’s most vital metrics. Good retention means users keep coming back. People use your product again and again because they find sufficient value in it for accomplishing their jobs-to-be-done.
In this article, we will look closely at retention and see why it’s so essential for your product and business.
→ Test your product management and data skills with this free Growth Skills Assessment Test.
→ Learn data-driven product management in Simulator by GoPractice.
→ Learn growth and realize the maximum potential of your product in Product Growth Simulator.
→ Learn to apply generative AI to create products and automate processes in Generative AI for Product Managers – Mini Simulator.
→ Learn AI/ML through practice by completing four projects around the most common AI problems in AI/ML Simulator for Product Managers.
Contents
- Defining retention
- Quick example of how to calculate retention for a mobile app
- Formula for calculating retention
- Daily, weekly, monthly, and quarterly retention
- How retention reflects the product’s value for the user
- How to know a “good” retention rate and make useful comparisons
- Relationship between long-term retention and product/market fit
- How to improve retention
- When long-term retention fails to fully reflect product value
- Further reading on retention
Defining retention
Retention is the metric that answers the question: How many people returned on Day X/Week X/Month X after trying the product for the first time? Retention is expressed as a percentage, indicating the share of people who used the product at Time X out of all the people who had used it previously.
Example of how to calculate retention for a mobile app
Whenever we talk about retention, we have to decide which day we want to use as our starting point. Here’s a simplified example.
Let’s imagine that on August 26, our (fictional) mobile app SuperApp had 1,300 new users try it out. This day, Day 0, will be our point of reference. In the context of retention, Day 0 refers to the day on which a user tries the product for the first time.
For determining how many SuperApp users came back to the app later, a product manager has two main options available:
- A product analytics system that receives events when users perform certain actions. Examples of these systems include Amplitude and Mixpanel.
- A SQL query to the database that stores information about all user actions and in-app events.
After reviewing data about the cohort of 1,300 users who come to the product on August 26, the product manager generates the following table. This table is used to calculate retention and build a graph.
| Day | Day 0 | Day 1 | Day 2 | Day 3 | Day 4 | Day 5 | Day 6 | Day 7 |
| Users | 1300 | 950 | 700 | 600 | 550 | 520 | 510 | 505 |
| Retention | 100% | 73% | 53% | 46% | 42% | 40% | 39% | 38% |
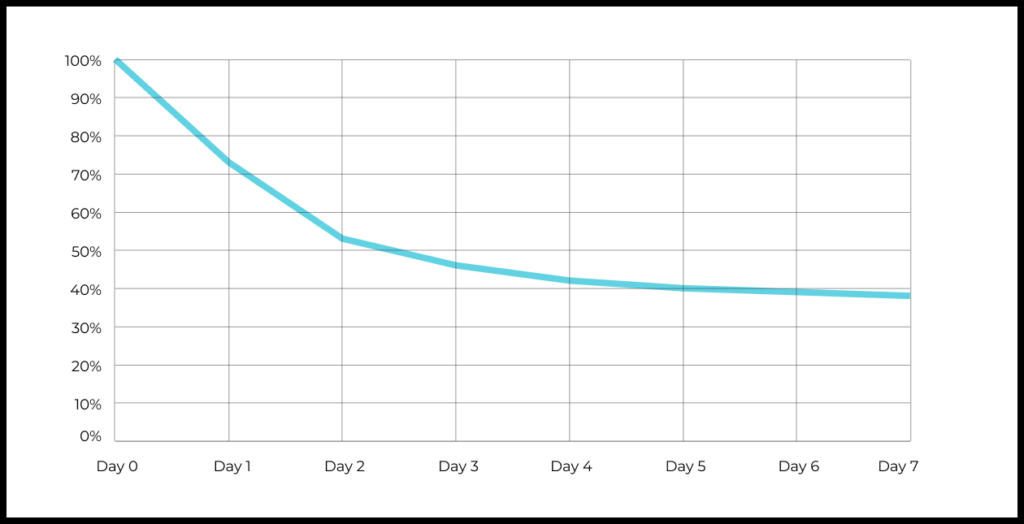
This tells the product manager that Day 7 Retention equals 38%, for example. So 38% of the users who opened the app for the first time on August 26 returned to the app seven days later.
For an example of how this would look in an Amplitude table and graph, check out the developer’s documentation.
Below we will explore how to interpret retention and the important insights it can offer. But we should start with a rock-solid understanding of how to calculate retention in the first place.
Formula for calculating retention
To calculate retention, you need to know changes in the number of active users within a certain cohort on a daily (or weekly/monthly) basis. For example:
- Take the number of new users on Day 0 (day when users opened your app for the first time).
- Take the number of active users on Day N (day of interest that you’ve picked for calculating retention).
- Divide the second number by the first one, and multiply by 100.
Day N Retention = (Users on Day N / Users on Day 0) * 100
Here’s how this would work for SuperApp, which we’ve been discussing:
Day 7 Retention = (505 / 1300) * 100 = 38%
In most cases it’s enough to simply get the basic idea behind this formula. The heavy lifting of calculating percentages is usually automated behind the scenes by your product analytics system or SQL.
If you’re not quite clear on the different methods for calculating retention (such as rolling retention), be sure to check out our article.
Retention can be daily, weekly, monthly, and quarterly
You have more options than just days for calculating retention. Your retention metric can also be for a week, month, quarter, or any other time period you want.
The choice of which period of time to use for retention will depend on your product’s lifecycle. For products that get used every day, a daily level of granularity makes sense. But with products that get used only once in a while, you’ll want to measure weekly or monthly retention.
Your motivation will also be a factor. If you are curious about why users fail to return after a certain event, daily retention will be more informative. But weekly retention is a better choice when looking at changes over a longer period of time.
Here are a few examples of these choices in practice:
- Daily retention: if you have a notes app that users access every day.
- Daily retention: for understanding the sudden outflow of users after a certain event (such as news of a data breach).
- Weekly retention: for a taxi app that most users will need only two or three times a week.
- Weekly retention: in the case of corporate products, because of working schedules and weekend lulls.
- Monthly retention: for an app with classifieds for goods and services that people open once or twice a month.
- Monthly retention: if you are curious about seasonal trends.
You can think of plenty more such examples of your own.
How retention reflects the product’s value for the user
Now it’s time to consider how to interpret retention numbers.
Users come back to the product if and only if they find value in it. The product helps users to accomplish a certain job-to-be-done periodically occurring in their lives.
But if they can’t solve that job-to-be-done, or the result is unsatisfactory to the user, they will stop coming back. Other possible causes for leaving could be if they get discouraged by the product’s interface or have to pay for functionality they had expected to get for free.
Take these two simplified examples:
- If a taxi app always has an available car, and the ride quality and price are better than the alternatives, the user will come back to the app. If there are no available cars or the prices are much higher than the alternatives, they probably won’t.
- If an online marketplace offers products that the user wants with low prices and fast delivery, the user will return to the app every time this need arises. If they can’t find the products they want, or delivery or product quality take a turn for the worse and competitors are offering better prices, they might switch to a different source.
These two situations can be illustrated with the following graph:
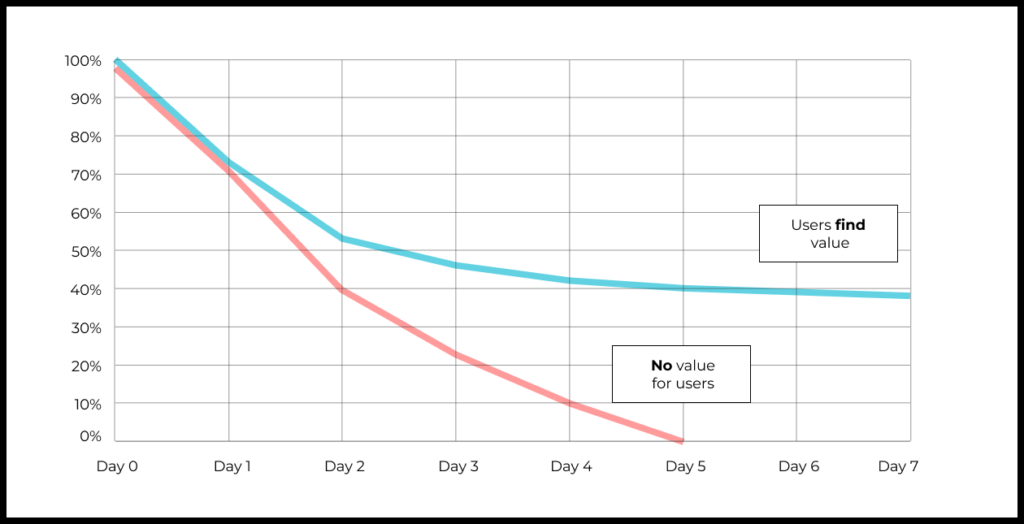
- For a product in which people find added value relative to the alternatives, the retention curve will gradually plateau parallel to the horizontal axis. People try out the product, figure out where it best solves their jobs-to-be-done, and start using it regularly.
- For a product that people don’t find value in, the retention curve will tend toward zero. People try out the product, don’t find any value, and leave.
So the shape of the retention curve can tell us important things about the product’s value for users.
How to know a “good” retention rate and make useful comparisons
Benchmarks for what makes a particular retention rate “good” or “bad” will differ based on the product and app. You can get a feel for these in Lenny Rachitsky’s article on the topic.
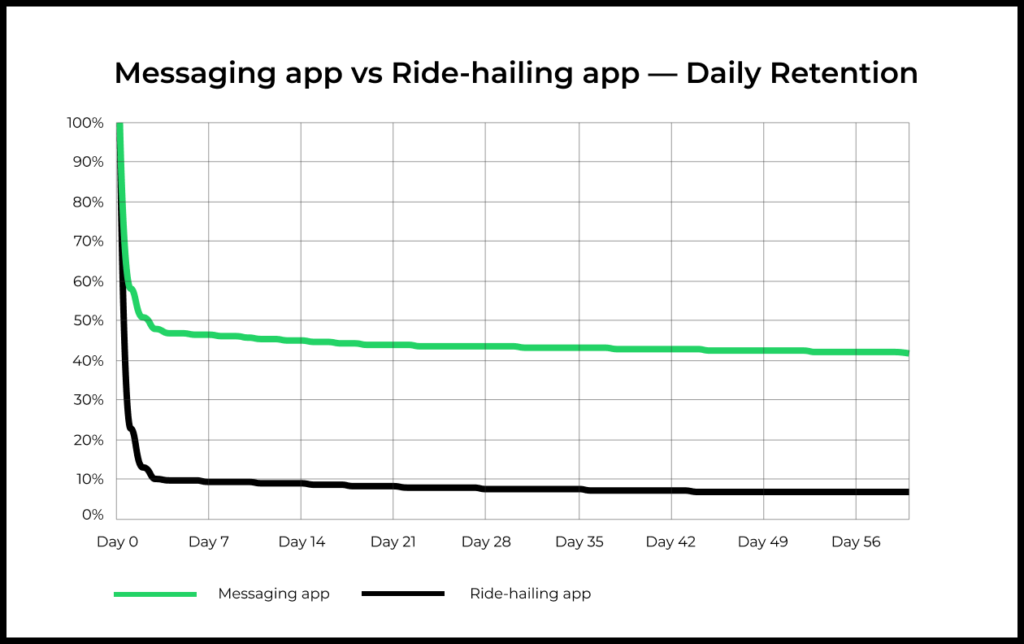
Good retention for a messaging app will be higher than good retention for a taxi app. And good retention for a taxi app will be higher than good retention for a plane ticket app.
The reason is that people use different products with different degrees of frequency. We tend to send messages every day, but order a taxi only every few days and buy plane tickets, on average, just once or twice a year.
This is why “good” retention can be defined usefully only in comparison to market leaders that address the same (or at least similar) job-to-be-done.
So if you’ve launched a new messaging app targeting a mass audience, your benchmarks for long-term retention should be peer apps like WhatsApp, Facebook Messenger, or Telegram. This will show how well your product helps people to accomplish their messaging jobs-to-be-done, plus how well it convinces unsure users who are new to the product to continue using it. But there’s no point in benchmarking your app’s retention against competing apps that have flopped or failed—that information will be useless to you.
Once in a very blue moon, there won’t be any other app to compare with. Perhaps little is publicly available about the market leaders or you are targeting a unique niche that has not seen dedicated products previously. In these cases, a plateau in long-term retention will suggest that your product is successful. But keep in mind that this is not a common situation.
Relationship between long-term retention and product/market fit
Retention after Day 30 is effectively your product’s long-term retention. This is usually enough time for people to evaluate your product for themselves and decide whether to continue using it.
Here’s a chart of long-term retention for SuperApp:
| Day | Day 1 | Day 7 | Day 14 | Day 21 | Day 28 | Day 35 | Day 42 | Day 49 |
| Retention | 73% | 38% | 35% | 33% | 32% | 32% | 31% | 31% |
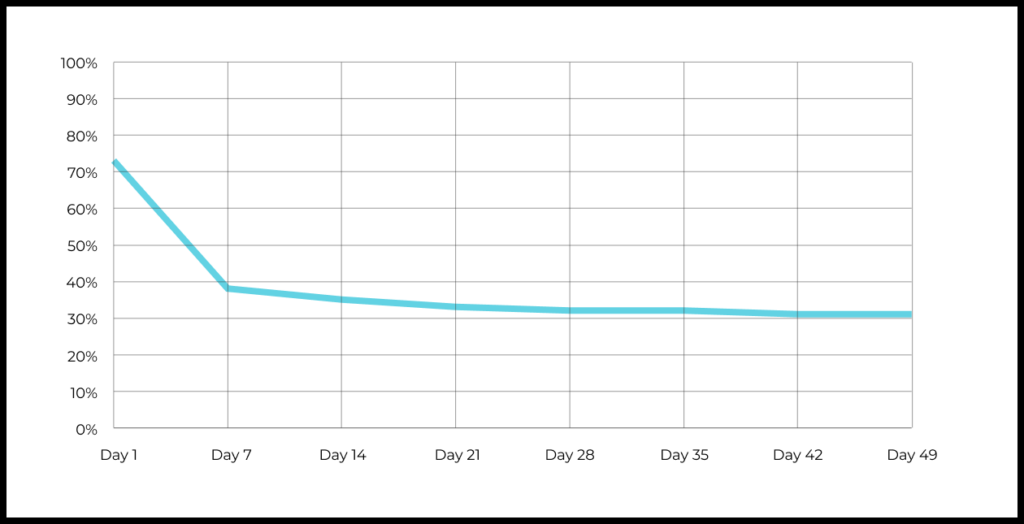
We see that after more than a month and a half (50 days), users are consistently coming back to the app. The retention curve, nearly flat now, has plateaued.
Enough time has passed for people to form a habit of using SuperApp for their job-to-be-done. Presumably they will maintain this habit until they find a better, more effective way of accomplishing that JTBD.
This means that the product has found its place on the market. The app found a segment of users who are willing to regularly use the app for accomplishing their JTBD. In other words, the app has product/market fit.A plateau in long-term retention is one of the criteria for product/market fit, which is critical for future product growth and maturity.
How to improve retention
Now we’ll detail the different levers available for leveling up retention:
- Improve the product (increase its value for users)
- Improve activation (reduce barriers and increase motivation so that users can find the product’s value)
- Pivot to greater JTBD frequency
- Nudge users
- Target a different user segment
Improve the product (increase its value for users)
Added value relative to other ways of accomplishing a JTBD is a key lever for improving retention. That’s why when we talk about “improving” the product, we specifically mean increasing its value relative to the alternatives.
Now we’ll add MegaApp, which competes with SuperApp, to the mix. The first version of MegaApp was a failure. Its retention was much worse than SuperApp’s.
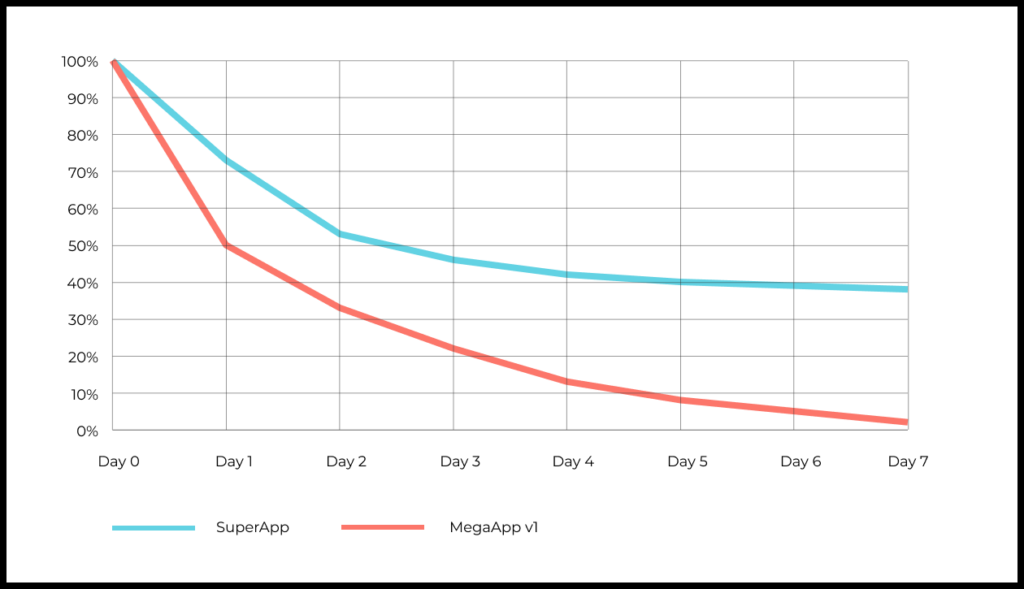
The MegaApp team realized that their product didn’t create enough value. Almost all of the users who tried the app would not find value, abandoning it entirely within a week.
The team worked to fix this and released an updated version of the app. The new version created more value than the alternatives, including SuperApp.
Now many users saw that MegaApp was better than the alternatives, so they kept using it a week after opening it for the first time. The retention curve for users who tried the overhauled app was much better than for the initial version.
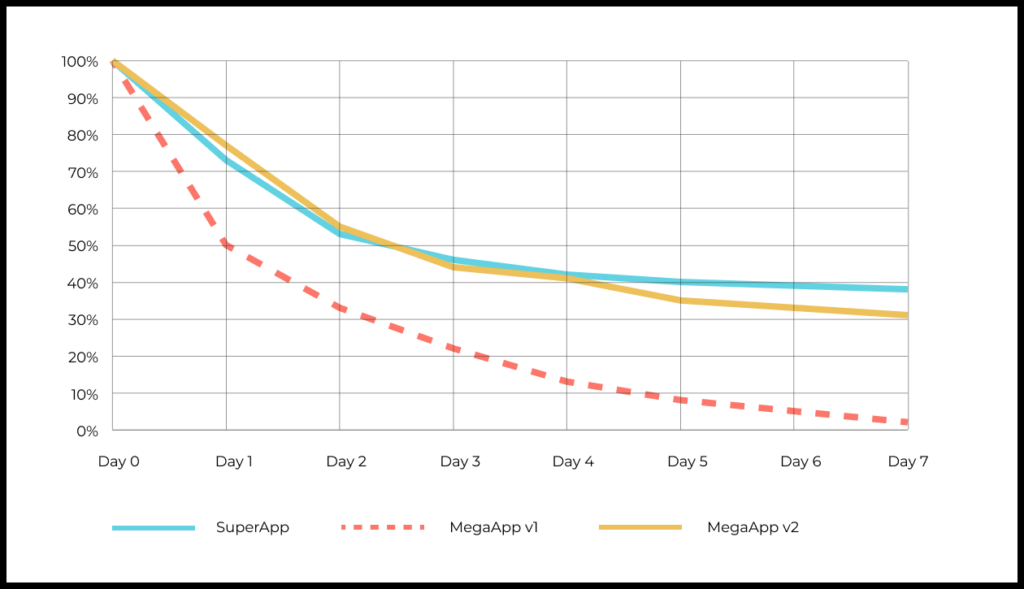
The MegaApp team found a way to increase the app’s added value. More people were sticking with the app for solving their job-to-be-done.
For more on how added value impacts retention, read our text on metrics for growth, products, added value, and JTBD resolution.
Improve activation (reduce barriers and increase motivation so that users can find the product’s value)
Just because an app contains substantial added value doesn’t necessarily mean that users will find it:
- If a photo editing app offers cool features, but onboarding is confusing and poorly designed, only the most dedicated users will persist to see features that are potentially valuable to them.
- An audiobook app might be interesting to a broad audience. But if users have to pay before ever hearing their first audiobook, most will probably drop out before reaching value.
These are just some of the most common issues with product activation—the stage of experience in the product prior to the user experiencing an “aha moment”.
Improving activation boils down to reducing barriers and strengthening user motivation. But this sort of work should come only after the product has proven its value already. Read more about this in our series on activation.
When structuring activation for a new product, design it to make the path to value as short and frictionless as possible.
By improving activation, you help more people to realize the product’s value. The result: better retention.
Pivot to greater JTBD frequency
In some cases, you can increase the frequency of the user JTBD or modify the product to solve a more frequently occurring JTBD.
Two simplified examples:
- For a food delivery app, you could add deliveries from supermarkets in order to address a need that people experience more often.
- If you’re offering a real estate app, you could add the ability to ask any housing-related questions and receive answers from professionals.
As people find reasons to come back to the product more often and find added value in it, retention will grow as well.
Nudge users
There are different ways of retaining users by nudging them with reminders, even if these users have stopped opening the product.
You can do this with emails, notifications, and special offers or sales.
These user interactions can support improved retention, although they are unlikely to do much for perceived value.
Target a different user segment
And finally, you can drive retention by working to attract users who can benefit more from your product and its value.
For example, by adding a new advertising channel you might engage people from a new segment who will find more value in the product than your current audience does. If this happens, retention should increase.
Let’s take a travel app for buying plane tickets targeted at a U.S. audience.
The average American flies on a plane about once or twice a year. If your ticket booking app is aimed at this mass market, retention will be miniscule.
But there is the frequent flyer segment. In the U.S., these flyers are just 10% of passengers but account for 70% of flights. Targeting this user segment offers substantial room for strengthening retention.
When long-term retention fails to fully reflect product value
There are certain products for which long-term retention will fail to reflect the product’s true value. Here are a few examples of these types of situations.
Job-to-be-done is finite and limited
If your app is for house buyers, long-term retention will eventually approach zero. Even the happiest user just isn’t going to keep buying one house after another.
If a user doesn’t open your app anymore, it’s not necessarily because they couldn’t complete their job-to-be-done. In fact, the opposite could be true: the user got their JTBD done, therefore they don’t need to come back to the product anymore.
This is a prime example of “good churn”, in which users recommend the app to their friends and return to the app if the same JTBD reoccurs later.
Another example. Dating apps can bring long-term value for people looking to meet a special someone. But people who successfully start a relationship thanks to the app will stop using it. It’s not because the product was disappointing or a failure for them—quite the contrary.
Irregular needs count, too
The long-term retention curve may bend toward zero for products that solve irregular or sporadic JTBDs. Buying plane tickets or reserving hotels, for example, is not something most people do every week.
But this doesn’t mean that people will stop using the product or that they believe it to be ineffective. They simply don’t open it that often, even if they consider it the best solution available.
In these cases, consider using monthly, or sometimes even quarterly or biannual, granularity.
Further reading on retention
For more on measuring, interpreting, and understanding retention, have a look at these materials: