
In the previous essay, we discussed why it is important for product managers to work on improving the efficiency of their solution to the target problem, and as a result, focus on the metrics of their product’s added value in comparison to alternative solutions.
In this essay, we will use a specific example to demonstrate why product metrics depend on the added value of the product. In particular, we will study the levers of influence on the Retention metric.
→ Test your product management and data skills with this free Growth Skills Assessment Test.
→ Learn data-driven product management in Simulator by GoPractice.
→ Learn growth and realize the maximum potential of your product in Product Growth Simulator.
→ Learn to apply generative AI to create products and automate processes in Generative AI for Product Managers – Mini Simulator.
→ Learn AI/ML through practice by completing four projects around the most common AI problems in AI/ML Simulator for Product Managers.
↓ All posts of the series:
→ Addressing user pain points vs solving user problems better.
→ Product manager skills: evolution of a PM role and its transformation.
→ Product metrics, growth metrics, and added value metrics.
→ Customer retention levers: task frequency and added value.
→ How to measure the added value of a product.
→ Should a product be 10 times better to achieve product/market fit?
→ Product/market fit can be weak or strong and can change over time.
→ Two types of product work: creating value and delivering value.
→ What is the difference between growth product manager, marketing manager, and core PM.
Example problem: Commuting between office and home
Meet Mike. He lives in a San Francisco suburb.
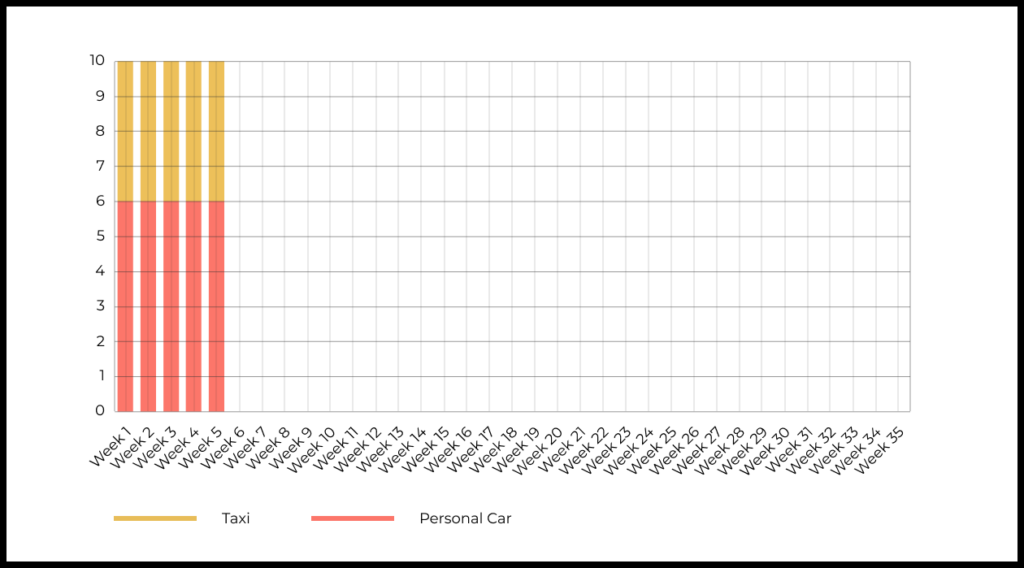
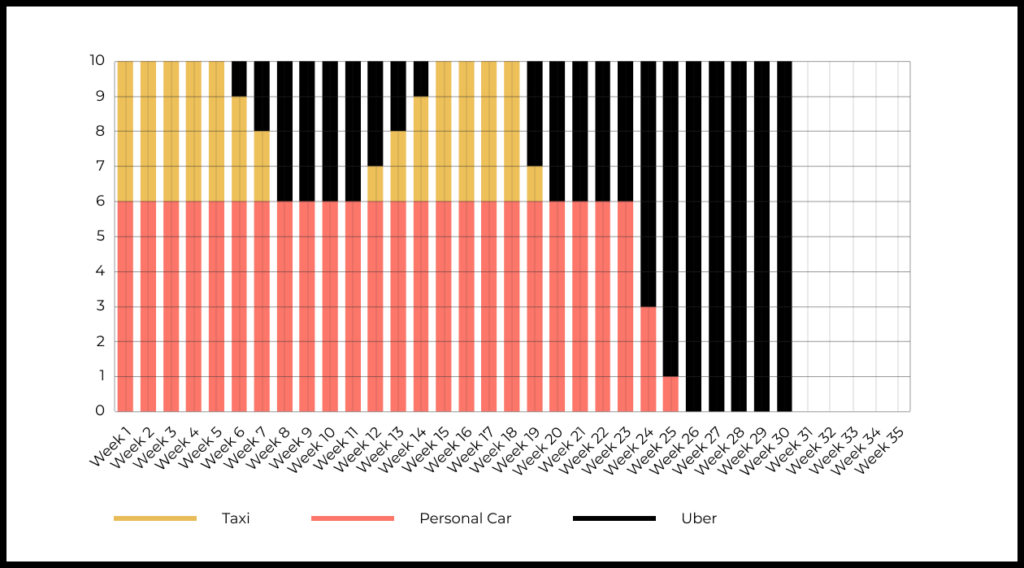
It is 2011. Mike works in an office. Every weekday he commutes from home to his office in the morning, and then comes back home in the evening. He does a total of 10 trips per week.
Previously, Mike had two ways to solve this task:
- Mike used his own car six times a week. It was convenient and the office had free parking space for employees. Moreover, he likes driving.
- Mike used the taxi four times a week. On Thursdays and Fridays, he went to a bar with his colleagues, so he could not use his own car. Taxi was the most efficient way for Mike to commute on these days.
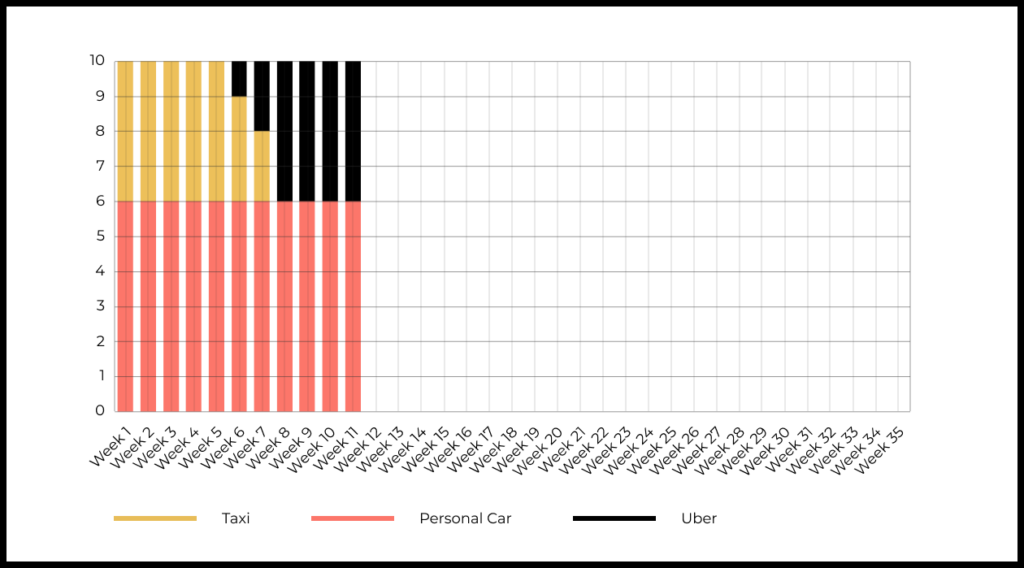
One day at the bar, a colleague told Mike about Uber, a new service that had recently launched in the city. Mike decided to try it and was very pleased with his first trip using the service.
Uber turned out to be more efficient than the taxi in all key parameters of the task:
- With Uber, you can order a car using a few taps in the app. When using a taxi service, you must call and wait for the operator’s response.
- Uber automatically detects your location. In the taxi service, you have to tell your address over the phone.
- In the Uber app, you can track the location of your ride, how long it will take to reach you, and where it is parked. When using a taxi, you need to wait for the driver outside, and sometimes call the driver to clarify exactly where he is parked.
- Uber’s pickup time is five minutes on average. For taxis, pick up time is usually 10–15 minutes or more.
- Uber cars are often in better condition than taxis.
- With Uber, payment is made automatically from the bank card linked to the app at the end of the trip. There is no need to pay the driver using cash or a terminal in the car.
- On average, the cost of an Uber ride is 1.5 times lower than a taxi.
Uber provided significant added value, so after a few rides, Mike decided to use Uber instead of taxi on his bar days.
At the same time, his own car was still more efficient than Uber on other days. From Mike’s point of view, using his car was cheaper, more comfortable, and more enjoyable.
Early Uber users in San Francisco were very happy with the service and therefore actively talked about it to their acquaintances. As a result, the number of users in the app grew much faster than the Uber team could acquire drivers.
The growing imbalance of supply and demand led to a decrease in the efficiency of Uber in a number of ways:
- The waiting time for the car increased to 15 minutes. At the same time, often during rush hours, there were no available rides.
- Uber was forced to raise prices to reduce demand. As a result, the cost of the trip first caught up with taxi rates, and then even exceeded them.
- Uber lowered requirements for new drivers to meet the growing demand for rides. But the tradeoff was that the quality standards of the vehicles and service decreased.
After several bad experiences with Uber, Mike decided to switch back to using taxis. At this point, the taxi solved his problem better than Uber and created added value.
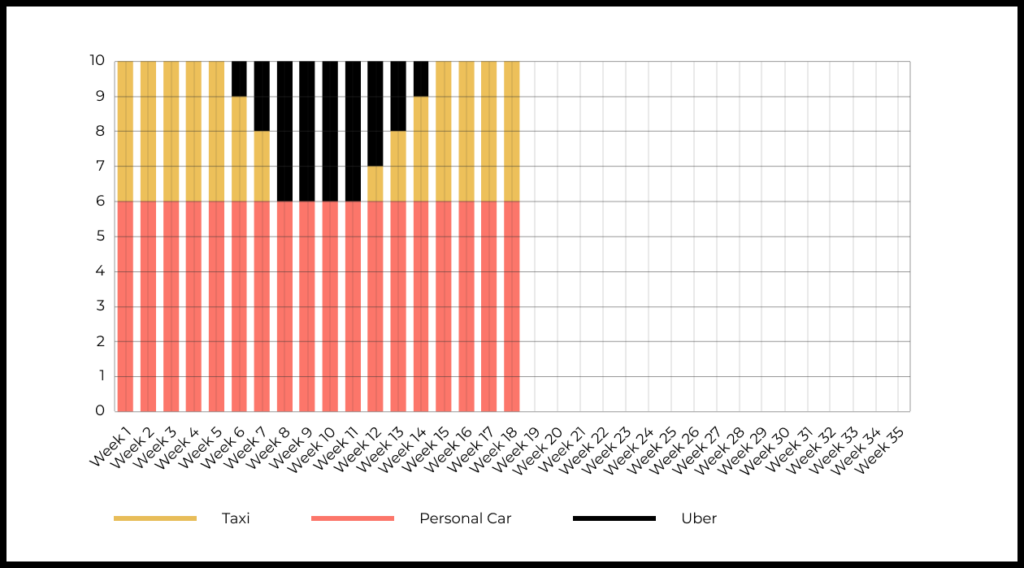
After a while, Uber was able to resolve the problems and restore the original level of service in San Francisco. The team sent out push notifications to users about the changes, and also offered motivational ride discounts to re-engage churned users. Mike switched back to Uber.
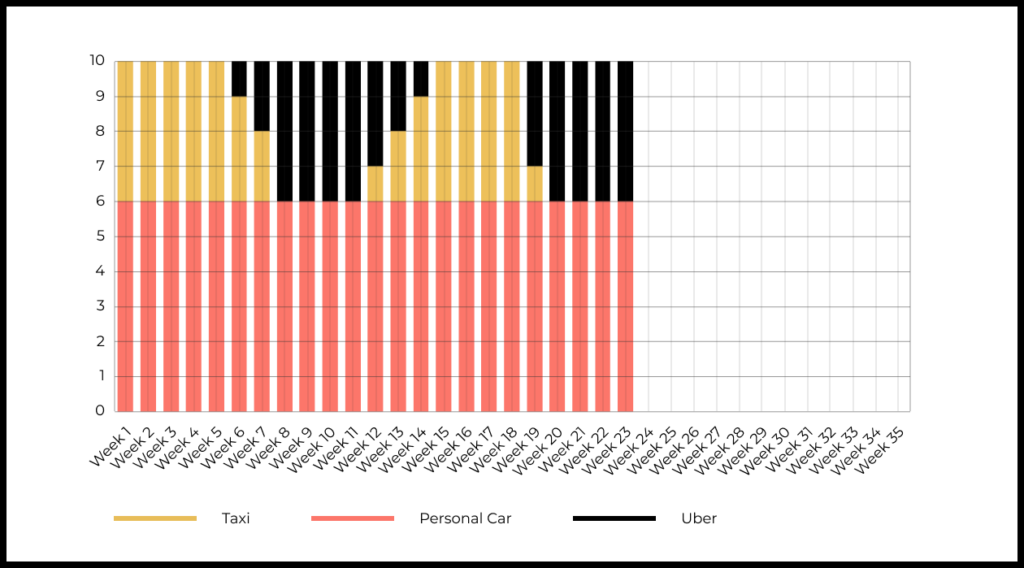
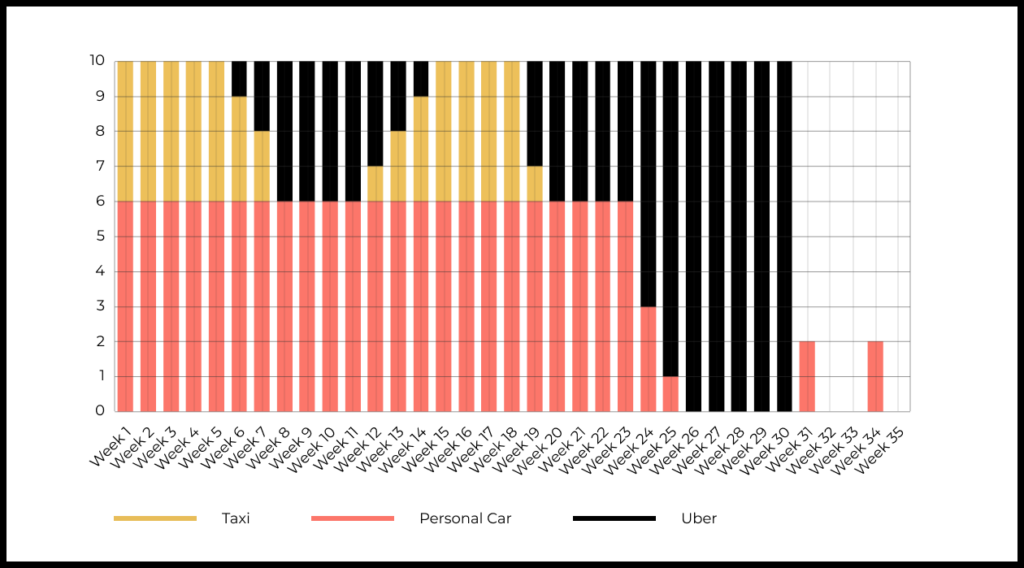
Mike’s office soon moved to a new building in the heart of the city. There was no free corporate parking space, and municipal parking spaces were very expensive.
At this point, for Mike, Uber became more efficent than his personal car in commuting between home and office. Now Uber was doing even more of the “work” in Mike’s life.
A while later, Mike’s company decided to switch from the expensive downtown office to remote work. At this point, the task of commuting to the office almost disappeared from Mike’s life—he only went there a couple of times to pick up personal items. As a result, the need for Uber as part of this use case also disappeared.
Product retention depends on the frequency of the task and the added value of the product
The above example illustrates the key factors that determine Retention:
- The frequency of the task for which the user considers your product (task characteristics).
- The added value of your product in comparison to alternatives (a measure of how effective a solution is compared to other methods).
If you plot Mike’s Retention in using taxis, his personal car, and Uber, you’ll see that these two variables determine the metric’s dynamics.
In reality, many people use Uber. But they make their decisions in exactly the same way as Mike does. At the moment when a task arises, a person chooses the most effective among the known and available solutions.
Let’s discuss these retention levers in more detail.
How to influence Retention by increasing the frequency of the task
The first lever of influence on Retention is how frequently the task occurs in a person’s life.
- In the example above, Mike had this task 10 times a week. But when the office closed, the task practically disappeared from his life. At this point, Mike stopped using both Uber and his personal car for commuting to the office, even though the efficiency of the products didn’t change.
- A reverse example would be an emergency at work, which created the need to commute to the office even on weekends. This would lead to an increase in the frequency of occurrence of the problem, and as a result, an increase in the use of appropriate solutions.
The product team’s leverage over Retention is limited from the perspective of task frequency. This is because frequency is more a characteristic of the task than the product.
Below we will look at several approaches that the team can still use to influence Retention through task frequency. They are used most often in products that solve low frequency tasks.
Related tasks and use cases
The first way to influence Retention through task frequency is to create features and sub-products that solve related tasks that happen more often. This allows you to increase the situations in the user’s life where your product is able to create value. For example, the Zillow team, a marketplace for buying real estate (a very rare task), launched the Zestimate service, which allows you to track the value of your home (a monthly task), as well as a content product with useful knowledge and insights on real estate (a weekly use case).
Top of Mind
The second way is to invest in being “Top of Mind” for your target users. Your goal is to make sure that every time a task arises, your service comes to mind first. Otherwise, it is likely that it will not even be considered as a potential solution. For example, the flight booking services invests a lot in promoting their product through brand advertising. They don’t expect people to buy a ticket while watching a YouTube video, but they want to make sure that their service is the first thing that comes to mind when this task arises in the future.
Shortcuts to product
The third way is to build shortcuts to your product in places where people might be looking for a solution to their problem. For example, for travel search queries, a significant part of the sites in the search results will either belong to Booking.com or have integrations with their service, and the entire search context will be clogged with their advertising. When you book a meeting in your Google calendar, a link to Google Meet will automatically be added to make the call.
Increasing the efficiency of the solution
The fourth way is to significantly increase the efficiency of the solution. This has a lot in common with increasing the added value, but in some cases, the increase in the problem-solving efficiency leads to an increase in the frequency of task in people’s life.
For example, twenty years ago people took far fewer photographs: cameras were not always available, their sizes were often not compact, and they required film rolls. In other words, the barriers to taking photos were so great that people would only take photos on special occasions. Now smartphones allow you to take photos at minimal cost. At the same time, social networks have created many new use cases where photos are useful.
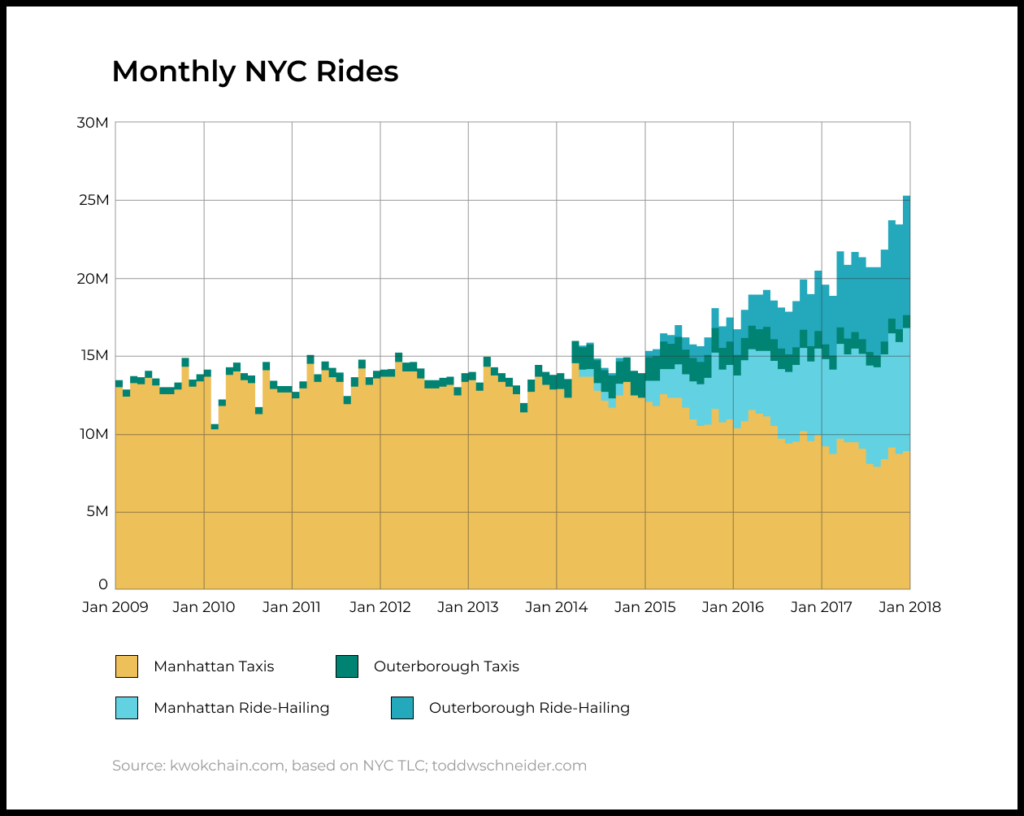
Another example is the growth of Uber in New York outside of Manhattan, where previously, only green taxis operated. The previous solution was so ineffective that people either used alternatives (metro, their own car) or refrained from traveling. Uber’s solution won the competition from the incumbent (“stay home and don’t go anywhere, because it’s difficult and long”) and increased the frequency of the task associated with Uber.
How to influence Retention by increasing efficiency and added value of the product
The second important leverage on Retention is the added value of the product in comparison to alternatives.
Every time Mike needed to commute to the office or home, he chose the product that could most effectively solve his problem, given the circumstances and context.
At first, he only used taxis on bar days because he couldn’t drive his own car
→ But then Uber appeared and proved to be more efficient than taxis
→ After the office moved to a new location with no free parking, Uber became more efficient than Mike’s personal car.
Note that the context in which the task occurs (going to a bar, parking, driving for pleasure) affects the effectiveness of different products as much as the products’ own features. When working on a product with a large number of users, it is very important to accurately understand the context of different user segments and optimize the product so that it effectively solves the problem in these conditions.
The Retention metric is a function of task frequency and added value. The levers of influence on the frequency of a task are few, but it is the product team’s responsibility to improve product efficiency and create added value. That is why product managers must deeply understand the task of the target users and the context of its occurrence. It is also is why they should focus on improving the effectiveness of their solution in comparison to alternatives.
Retention is not the end goal
Often teams formulate their goals in the style of “increase Retention by N%”. This usually means that they do not fully understand what needs to be done, but only say that the growth of such a metric is good.
Retention and other product metrics depend on the problem a product solves and its added value. That is why product managers must think about how they can solve the problem of users more efficiently and how they can create added value. Only after this should they think about the impact of potential projects on retention, conversion to purchase, LTV and other metrics.
Product metrics should be used as a feedback loop to see if you have created more value for users or not. Added value metrics are the core that fuels your product and its growth.