
This is part of a series of articles by Oleg Ya on the basics of product management and building products that people need.
In this article, you will learn to measure the added value of a product.
We will use simple examples to show how it works for different types of products. In previous articles, we discussed why increasing the added value is the core of product work. We also explained why product metrics do not always clearly characterize the effectiveness of solving a problem, so we introduced the concepts of problem-solving efficiency and added value metrics.
Measuring efficiency and added value is more complicated than it might seem. In this essay, we will explore some of the tried and tested ways to measure them.
→ Test your product management and data skills with this free Growth Skills Assessment Test.
→ Learn data-driven product management in Simulator by GoPractice.
→ Learn growth and realize the maximum potential of your product in Product Growth Simulator.
→ Learn to apply generative AI to create products and automate processes in Generative AI for Product Managers – Mini Simulator.
→ Learn AI/ML through practice by completing four projects around the most common AI problems in AI/ML Simulator for Product Managers.
↓ All posts of the series:
→ Addressing user pain points vs solving user problems better.
→ Product manager skills: evolution of a PM role and its transformation.
→ Product metrics, growth metrics, and added value metrics.
→ Customer retention levers: task frequency and added value.
→ How to measure the added value of a product.
→ Should a product be 10 times better to achieve product/market fit?
→ Product/market fit can be weak or strong and can change over time.
→ Two types of product work: creating value and delivering value.
→ What is the difference between growth product manager, marketing manager, and core PM.
The Challenges of Measuring Added Value
Measuring the problem-solving effectiveness and added value of a product is challenging for several reasons.
- Efficiency depends not only on the product itself, but also on the task for which it is used. For example, an SUV’s performance will be very different when driven on the wide roads of Iceland in comparison the narrow streets of Rome.
- The effectiveness of a product depends on the context. For example, the added value of a table in the shade will vary greatly between a cool day and a very hot day.
- The value of a product is subjective. Some people like drama films, and some comedy. Some people like the color black, and some purple.
- The perception of value is not always rational. People can be affected by their own cognitive biases, or they might have incomplete information and make emotional decisions.
Despite all this, in general, people have a very good grasp of value. We know which shoes are suitable for running and which are suitable for going to the theater. We know which TV series was interesting and which was boring. We boil water in a kettle, not in a saucepan. We understand which employee is more likely to cope with a certain task.
All these judgments require us to be able to determine and compare the effectiveness and value of different solutions to our problems, even if we can’t measure them quantitatively.
Things get complicated when we start making products for other people. Here, we face many different users, and each have their own way to evaluate the product’s effectiveness depending on the task, context, and personal characteristics.
This is why measuring the effectiveness of a product and its added value in comparison to alternatives is a fundamental part of product work. Without such measurements, you won’t be able to say what it means to make a product better. But first, we need to narrow down the context for measuring added value.
Measuring added value relative to a competitor within a specific “job”
We will not talk about measuring the added value of a product as follows:
- Regarding a specific competitor (alternative);
- In the context of specific task or Job To Be Done (JTBD).
We will define “job-to-be-done” in accordance with Clayton Christensen’s version of the JTBD framework, where a specific Job To Be Done consists of two elements:
- The problem that a person wants to solve
- The context in which it occurs
How to assess the added value of a product
The following is a high-level process for estimating added value of a product:
Step 1. Determine the variables that define the effectiveness of solving the “job-to-be-done.” Important: the variables shouldn’t depend on the specific method of solving the problem. They are defined by the “job” and therefore should be suitable for measuring the effectiveness of any way of doing it.
For example, the wording “John wants to get to the airport using Uber” references a specific way of solving the problem, so it is not suitable. But the wording “John wants to get to the airport as soon as possible” is suitable because it can apply to different ways of solving the problem. We can use time to get to the destination to compare the efficiency of different solutions.
Step 2. Compare available solutions based on these variables.
- If all characteristics are measured in one unit of measurement, then combine them into one metric characterizing the effectiveness of products.
- If the characteristics are measured in different units, then try to understand the weight and importance of each of the factors for users. And based on this, understand which product solves the problem better.
For example, you can compare different ways to get to the airport base on the time that John spends on the road. But it may be necessary to consider both the cost and convenience of different ways of getting to the airport, then you will have to prioritize those factors based on what matters most to John.
This method can be applied in different ways depending on the specific “job-to-be-done” and context. We’ll look at some examples below to help you adapt it to measure your product’s added value. We’ve simplified the examples to make it easier to discuss them.
Measuring added value when efficiency variables have a common unit
Consider the “job-to-be-done” of accepting payments in an online marketplace.
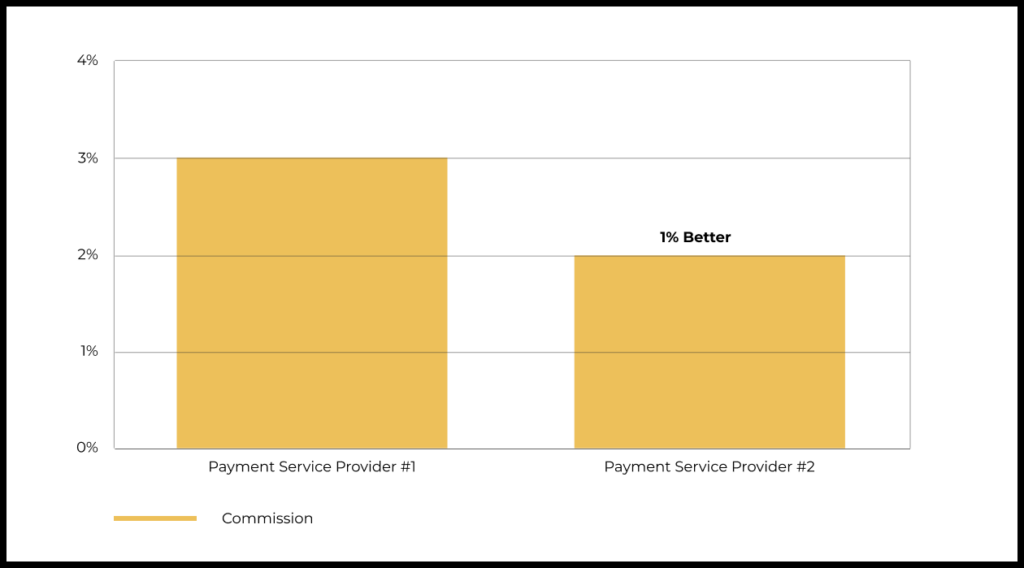
Your current payment provider takes a 3% commission on every payment. A competing service comes to you and offers online payments at a competitive 2% commission rate.
At this stage, the added value of the second provider for you is a 1% saving on turnover. At the scale of your business, this added value is enough to integrate the service and run an experiment.
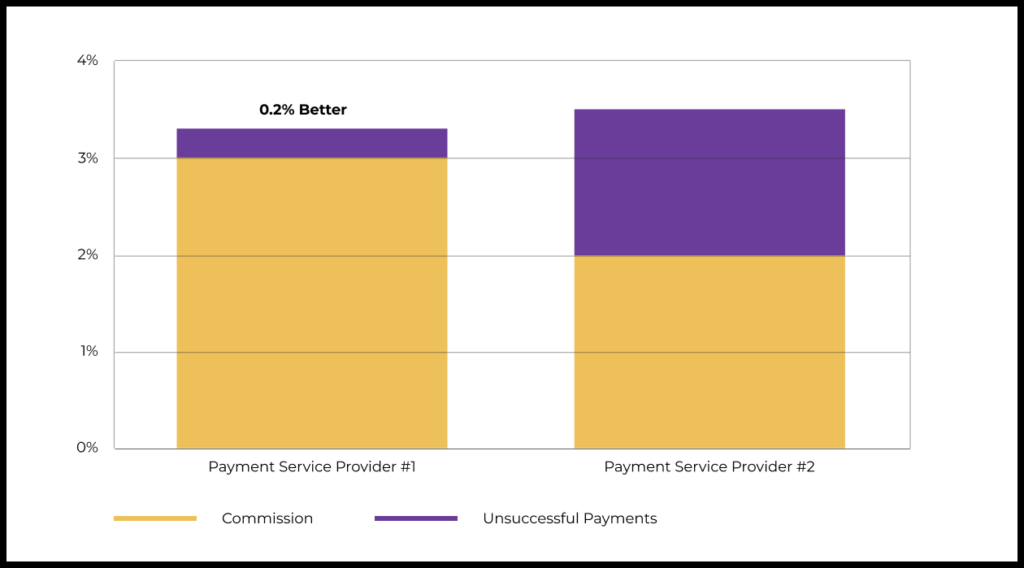
After integrating and launching a new service to a small portion of your users, you find that the new provider’s payment throughput (the proportion of initiated transactions that were successfully processed) is worse than the old provider’s. Because of this problem, the new provider causes you to lose 1.5% of your turnover in comparison to the old one’s 0.3%.
We now have two characteristics to assess the efficiency of online payment providers: The commission rate of the service and payment throughput. Both of these characteristics are measured in the same unit, so we can calculate a combined metric that characterizes the overall effectiveness of each of the solutions.
A month after starting the experiment, you receive the first data on another important variable: how effectively each of the providers detects and blocks fraudulent transactions.
In this case, the old service did a sloppier job and lost 0.5% to fraud while the new provider reduced fraud to 0.1%.
All three characteristics are measured in the same unit, so we can easily combine them into one metric that characterizes the efficiency of online payment solutions. This combined metric will help you to evaluate and compare the added value of different solutions.
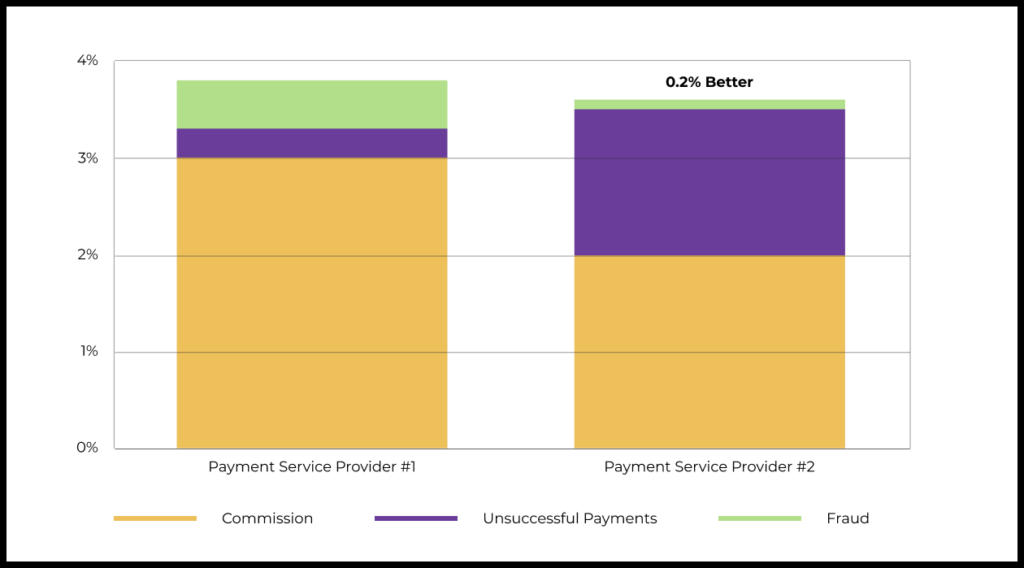
If the derived variables fully characterize the effectiveness of solving the problem of accepting payments, then the new payment provider creates added value in comparison to the old one. The old service cost the marketplace 3.8% of its turnover in comparison to 3.6% for the new service. Therefore the new service had an added value of 0.2% on turnover.
In the considered example, all characteristics of the “job-to-be-done” had a common unit of measurement and, as a result, we managed to derive a single efficiency metric. But this is not always possible. Let’s look at an example of another “job.”
Measuring added value when efficiency variables have different units
Let’s consider the task of buying a product online.
First, we define the variables that determine the efficiency of solving the problem:
- Product availability: If the product is not available, then it will be impossible to solve the problem.
- Cost of goods: The lower the price of the goods in the store, the better for the buyer.
- Cost of delivery: The lower the shipping cost, the better.
- Delivery speed: The sooner the buyer receives the goods, the better.
- Delivery reliability: If the service regularly disrupts delivery times, then this may be reason for choosing an alternative.
- Conditions and cost of return: The buyer wants to be able to easily return an item if it is not suitable.
In the online payments example, all performance variables for solving the problem were measured as a share of turnover, so we could easily derive an overall performance metric. But for online shopping use-case, things are different.
Delivery speed is measured in time, cost in money, and reliability in the proportion of orders delivered on time. We can’t compound all this information into a single efficiency metric.
Instead, we must calculate the added value of available online stores by comparing each of the variables separately.
Comparing these variables will allow you to understand whether your product (a certain online store) creates added value for the user or not.
You can also expand the approach and calculate these variables for different categories of products on your store. This will allow you to understand in which use-cases your product is more effective, and in which it is less.
Having a dashboard that compares your online store with alternatives across different efficiency variables (assortment and prices for goods in different categories, costs, reliability, ease of delivery, and return conditions) will allow you to understand where you are more efficient and where you are lagging behind. Maybe you are better than your competitors in solving the problem of buying expensive clothes from premium brands, but you are far behind in the sports shoes category.
Often, comparing your product to the alternatives on efficiency variables will allow you to understand user behavior and the dynamics of market shares. This is a good foundation to start thinking about broader product strategy. You should use your understanding or product’s relevant performance on these variables as guide to prioritize and implement projects.
In a previous article, we used a similar method to assess the added value of Uber in comparison to regular taxi services. Since we could not combine all the variables into one metric, we compared the products for each of them separately.
How the Amazon team builds by improving the efficiency of solving customer problems
Invent and Wander is a collection of speeches and letters from Amazon founder Jeff Bezos to shareholders.
These letters clearly show how, from the very foundation of the company, Bezos shaped product work around finding ways to improve the efficiency of solving a problem for the customer. The following quote illustrates this well:
“I very frequently get the question: ‘What’s going to change in the next 10 years?’ And that is a very interesting question; it’s a very common one. I almost never get the question: ‘What’s not going to change in the next 10 years?’ And I submit to you that that second question is actually the more important of the two – because you can build a business strategy around the things that are stable in time. […] In our retail business, we know that customers want low prices, and I know that’s going to be true 10 years from now. They want fast delivery; they want vast selection. It’s impossible to imagine a future 10 years from now where a customer comes up and says, ‘Jeff I love Amazon; I just wish the prices were a little higher,’ or ‘I love Amazon; I just wish you’d deliver a little more slowly.’ Impossible. And so the effort we put into those things, spinning those things up, we know the energy we put into it today will still be paying off dividends for our customers 10 years from now. When you have something that you know is true, even over the long term, you can afford to put a lot of energy into it.”
Jeff Bezos
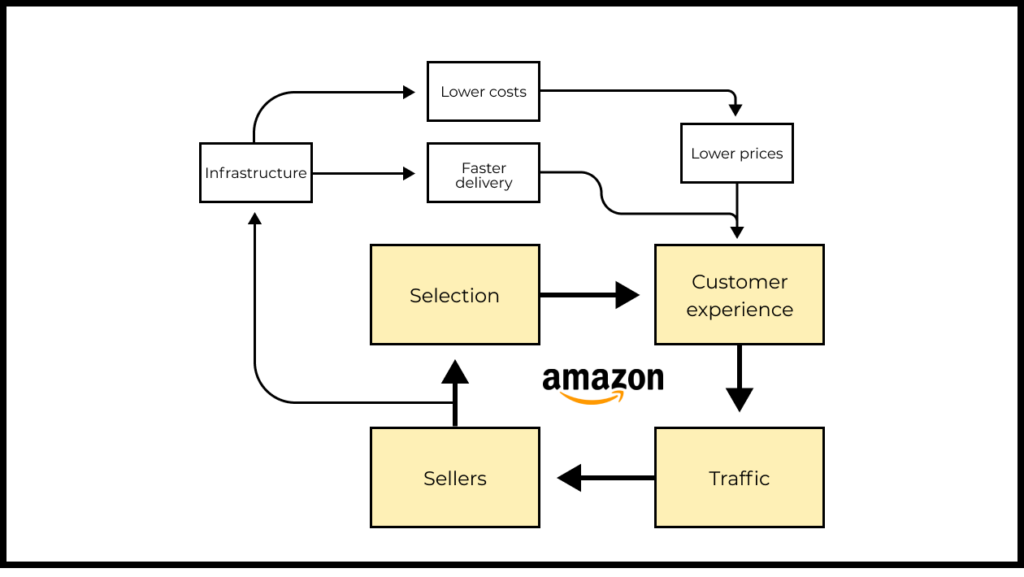
Low prices, fast delivery, great selection. Most of Amazon’s projects are aimed to improve these aspects of solving their customers’ problems. Here are a few examples:
- Launched in 2004, the Prime subscription reduced the cost and delivery time for subscribers. The price reduction led to an increase in demand and a decrease in the share of fixed costs of goods, which again allowed the company to reduce prices.
- The launch of a marketplace for third-party sellers expanded the range of available products, increased competition (including with Amazon’s own products), and lowered prices for consumers.
- The launch of FBA (Fulfilled by Amazon) made it possible to increase the reliability and speed of delivery of goods from the marketplace, which again increased demand and lowered prices.
The chart below shows the number of products available for purchase with delivery times up to two days for various US marketplaces.
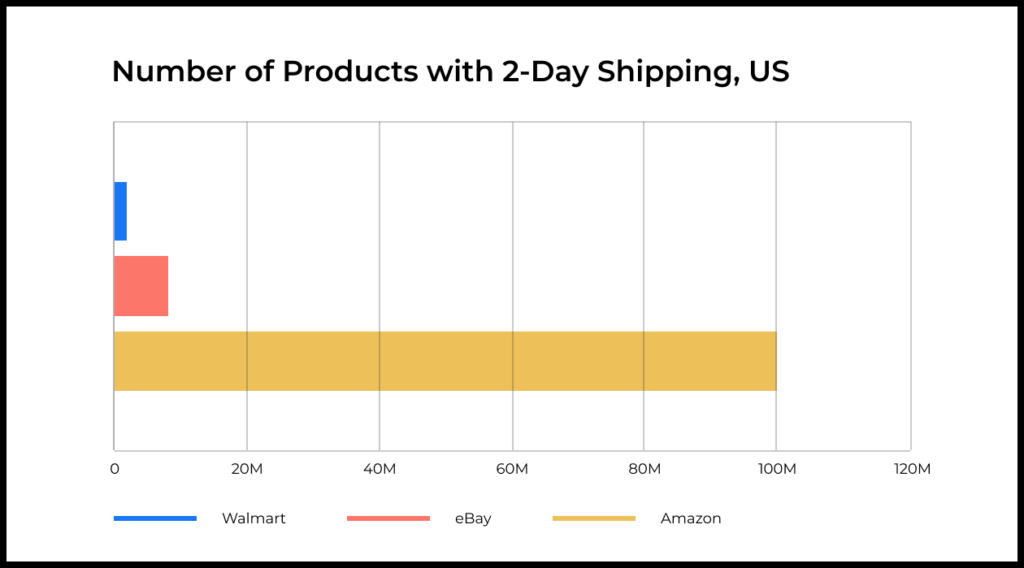
Amazon is so far ahead the competition that other players in the market no longer have a chance to engage in direct competition:
- It is more profitable for sellers to place their goods on Amazon; sales are higher, which means Amazon solves their problem more efficiently.
- As a result, Amazon has the largest number of sellers and, by extension, the best selection of products in most categories.
- Having a large number of sellers increases competition and ensures that Amazon has lower prices compared to competitors.
- The importance of Amazon as a sales channel forces sellers to comply with Amazon’s strict requirements and provide a high level of service.
Thus, Amazon solves the problem of end users more efficiently than most of its direct competitors. There is no reason for Amazon customers to switch to alternatives, including Walmart and eBay.
Consistent work over the years to improve the efficiency of the online shopping experience has allowed Amazon to create huge added value over alternatives and has become the foundation of their dominance in the e-commerce market in the US and other countries.
The importance of the variables depends on the problem being solved and the context
If Amazon is so strong in all aspects of solving the problem of online shopping, then how can other e-commerce platforms compete with it?
It is simple. Within certain tasks and contexts, Amazon can lose to competitors in terms of efficiency.
For example, Farfetch is better than Amazon for purchasing expensive designer brands. Many expensive clothing and accessory brands are reluctant to be listed on Amazon in order to stay away from cheaper alternatives. Farfetch, on the other hand, focuses on selling luxury products, which allows them to achieve a more complete and high-quality assortment in this segment.
AliExpress is better at solving the problem of buying low-priced goods for people who live in regions that are poorly covered by other stores (both online and offline). Within such a task and context, delivery time and the convenience of returns are less important (AliExpress’s average delivery time can be weeks, and returning goods often costs more than the purchased item itself). The key variables for this use case are low prices and a “unique” assortment that is not available in local stores.
Flash sale services like the French Veepee are able to provide up to 70-percent discounts on brand products, as they form their stock from unsold leftovers. If you need a specific model of Nike sneakers from the new collection, then this service will not help. If you just want to buy Nike sneakers at a big discount, then Veepee will outperform Amazon.
As Michael Porter said, your goal is not to be the best in your industry. It is to offer a unique product tailored to the task and context of a particular segment. By narrowing the task and context, you can find a segment where you will create added value, and then optimize for it. That is why we evaluate the added value within the context of a particular “job-to-be-done.”
Measuring added value for the task of “finding a date”
Above, we considered approaches to assessing the added value for online payments and shopping. In the first case, we were able to reduce all performance variables to one metric. In the second case, we isolated the variables and compared solutions based on each of those variables.
But there are tasks where it is much more difficult to select and compare variables. One example is the task of finding a date partner.
If you have ever used dating sites or apps, then you know that this activity requires effort and time: look through many profiles, write messages, build a relationship with a potential partner, and arrange a meeting.
In this case, we can define a performance metric based on our understanding of “work.” For example, one option might be the amount of time and effort it takes to get one date.
Let’s say you downloaded two dating apps and spent an hour on each of them:
- In the first one, you got seven matches, four active chats, and two date arrangements.
- In the second, you got two matches, one active chat, and one date arrangment.
The first product gave you a greater return on your investment of time and effort, meaning it created more value. You are more likely to continue investing your time and energy in this application.
This metric characterizes the effectiveness of the “job” quite well. But how to measure it?
The easiest way is based on actual product usage data, e.g., how much effort (time in app, profiles viewed, messages sent) it takes a user to get a date or an active chat (a good proxy metric for dates).
Such a metric is easy to calculate but has a problem: we cannot calculate it for competing products, which means we cannot understand how our performance compares to them. Are we creating added value or not?
Another way is to regularly conduct a study where a group of people will invest the same amount of effort in your product and a competing product, and then compare the result (active chats and dates). This is a more expensive method, but it allows you to analyze the added value in relation to alternatives.
Tasks where it is impossible to define the performance metrics of the solution
There are a number of tasks where it is very difficult to define the metrics for evaluating problem-solving efficiency and added value.
For example, how can you determine whether a movie is better than reading a book as a leisure activity in the evening? Will a new Netflix series be more entertaining than a new PlayStation game?
For some tasks, it is impossible to define an objective measure of efficiency. In these cases we have to turn to product metrics and measure effectiveness based on user feedback and activity (product metrics).
In the previous article, we discussed that this is not the best approach. Ideally, performance metrics should not be tied to a specific method for solving a problem (that is, a specific product). But in some situations, you will have to resort to this method.
Among mobile games of a similar genre, Retention and Engagement will be good indicators to compare which product best solves the user’s problem. For movies, an average rating based on user reviews will help you understand which product is more likely to help you have a good time.
Added value is a key growth driver
People choose a new product because it makes their life better. That is why increasing added value is the core of product work.
To do this kind of work consciously, you need to be able to measure the added value of a product relative to alternatives.
Step 1. Determine the variables that characterize the effectiveness of solving the task. Important: the variables you select should not depend on the method of solving the problem. They are defined by problem itself and therefore should be suitable for measuring the effectiveness of any solution.
Step 2. Compare available products to solve the problem based on these variables.
- If all characteristics are measured in a common unit, then you can use a compound metric to characterize the effectiveness of products.
- If the characteristics are measured in different units, then try to understand the weight and importance of each of the factors holds for users. And based on this, understand which product solves problems better.
- In some cases, you will need to define a performance metric from your own understanding of “work.”
For some tasks and contexts, it will not be possible to determine a performance metric that is not tied to a product (for example, choosing a movie to watch in the evening after work). In such a situation, you can use product metrics.
Measuring added value is complicated but very important for meaningful work on product development.