
Experienced product managers know that their ability to clearly relay complex information is just as important as their ability to drive results. That’s why product managers need to learn how to visualize data effectively to communicate their findings and suggest opportunities.
While data visualization software has become increasingly accessible, selecting the right chart types is essential to accurately presenting your data. In this guide, we’ll teach you how to select the right chart types to display your data and meet your objectives.
To illustrate how each chart type can be applied in real-world situations, we’ve included examples of data and visualizations for a fictional product, ThinkNotesAI, an AI-enhanced note-taking app.
Thanks to Kristen Poli for helping craft this piece for GoPractice.
Kristen Poli is a product leader and tech journalist.
She previously held the position of product manager at Contently and was the product management lead at Curacity.
Her articles have been published in outlets like WIRED and Hackernoon.
Selecting a chart type
Once you’ve selected the right software, it’s time to start visualizing your data. To tell a coherent story based on your findings, it’s important to identify a particular chart type that corresponds with the way your data is organized and distributed.
Below, you’ll find a non-exhaustive list of chart options available across the majority of data visualization platforms, along with a set of product-specific use cases for each:
Line Charts
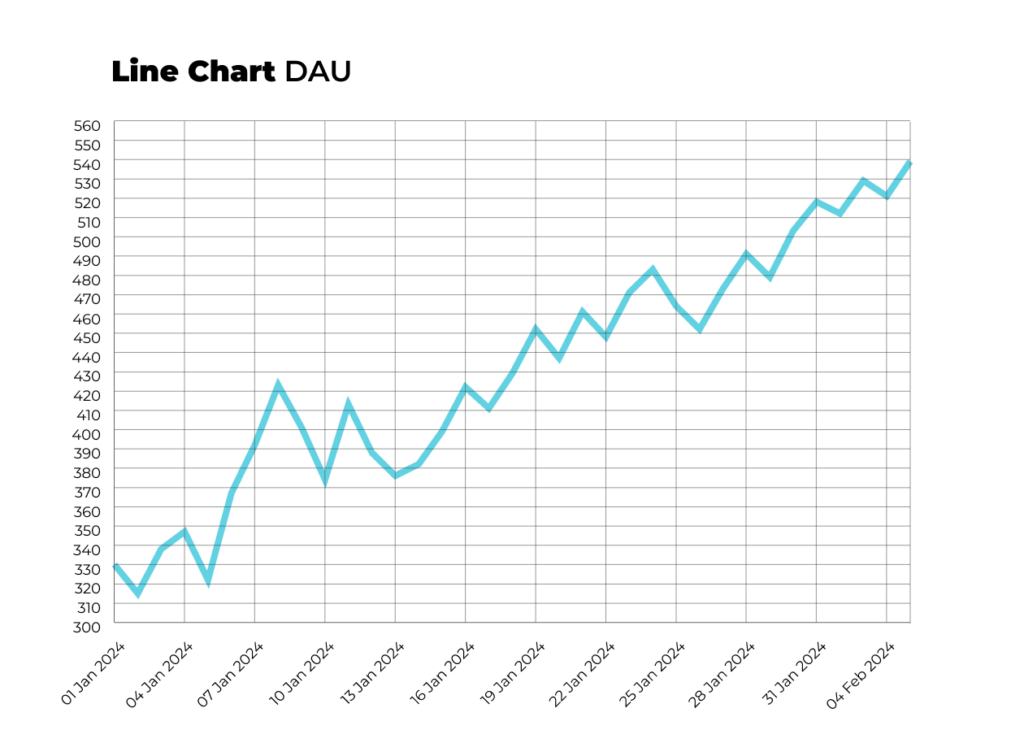
If you’re seeking to demonstrate the rise (or fall) of a particular trend over time, consider using a line chart. When scaled correctly, line charts are particularly useful for highlighting small fluctuations in values, such as the number of new users, sign-ups, or stock prices. Because of their adaptability, they can show continuous data effectively. As such, line charts are often used to compare trends across multiple series of data and showcase forecasts.
Example: The amount of daily active users by day for ThinkNotesAI in January 2024
Strengths:
- Ideal for showing continuous data, especially time series data
- Can accommodate small fluctuations in values
Weaknesses:
- Not suited to compare unrelated categories of data
- Difficult to read when data points are widely varied or sparse
Area + Stacked Area Charts
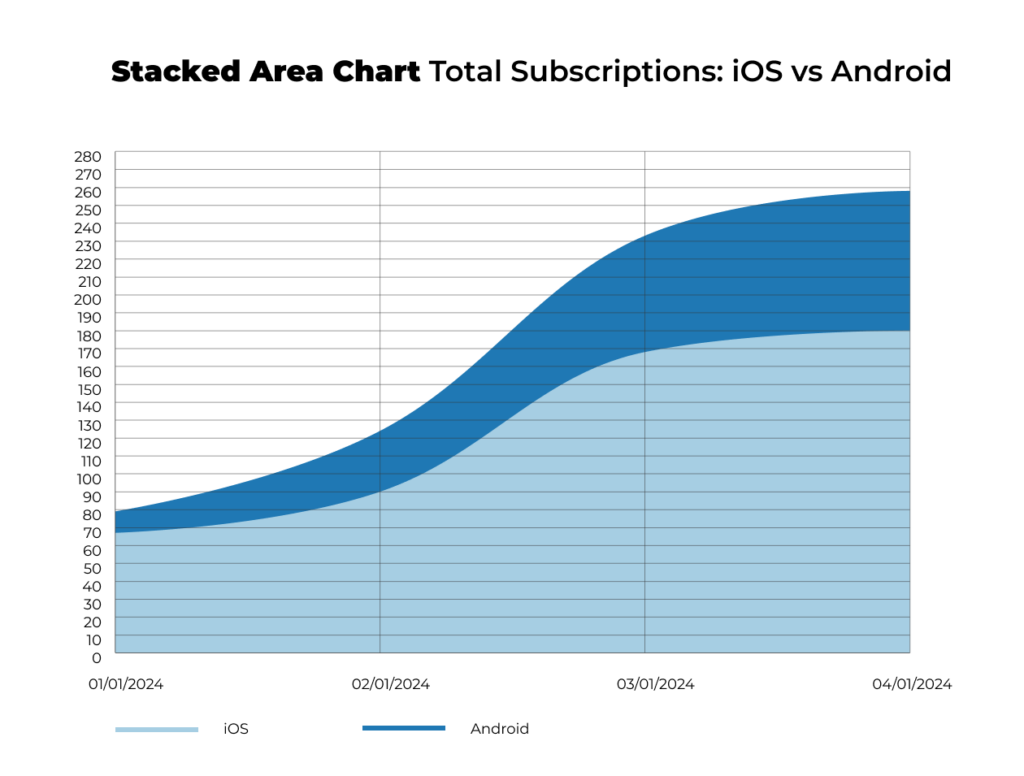
Like line charts, area charts are useful for displaying trends (especially as they relate to cumulative changes) over time. The particular advantage offered by area charts, which offer increased opacity and color, is their ability to highlight the magnitude of key data. Their counterparts, stacked area charts, can provide further insight by showcasing how different categories of items contribute to a specific outcome. Due to these factors, stacked area charts are best used to compare cumulative values over a period of time.
Example: The amount of ThinkNotesAI lifetime subscriptions sold on iOS and Android devices in Q1 2024
Strengths:
- Excellent for displaying cumulative values (running totals)
- Can display part-to-whole relationships and trends
Weaknesses:
- Because stacked area charts typically rely on color, they are less suited for black and white displays
- Multiple series of data can easily become obfuscated
Bar Charts + Grouped Bar Charts
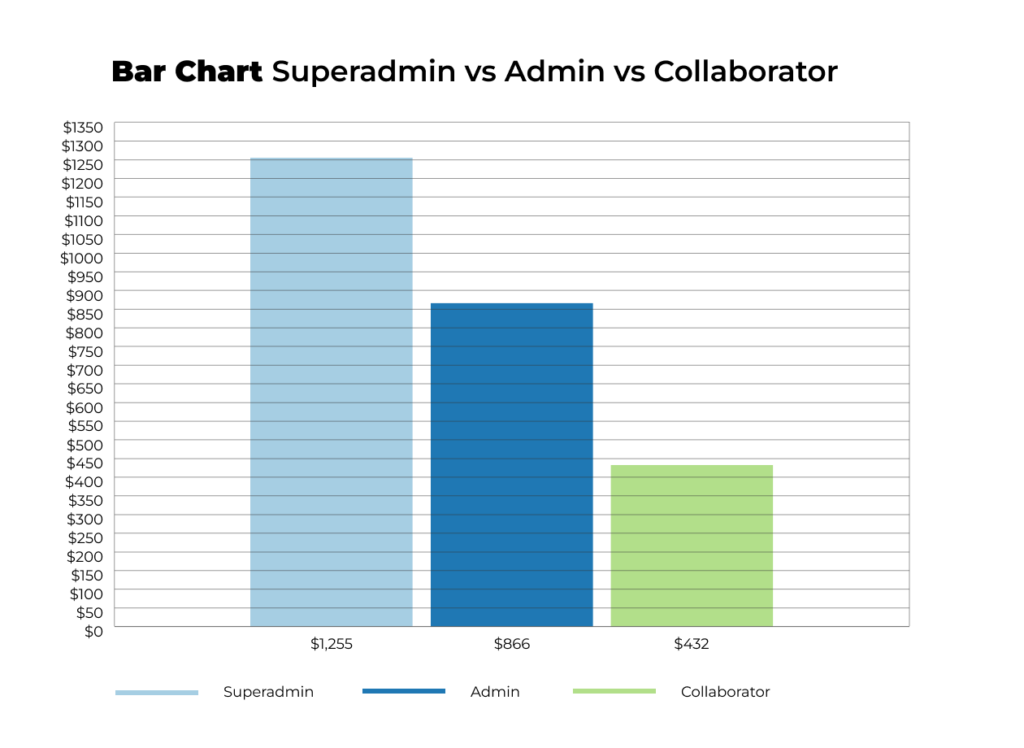
Bar charts are best used to compare and contrast discrete categories of values. Like line charts, they are sometimes used to compare items across different time periods, such as fiscal years or quarters. Bar charts can be used more generally to showcase how different categories fare across one or more success metrics. By grouping multiple bars together when creating a grouped bar chart, viewers can better understand how different parts relate to a whole across two levels of detail.
Example: The amount of lifetime revenue generated by each user role to date (superadmin, admin, collaborator, etc.)
Strengths:
- Great for ranking ordered (ex.letter grades) or unordered categories (ex. user types)
- Highly flexible and suitable for many comparisons
Weaknesses:
- Unsuitable for items with long category labels
- Not recommended for showing data over time
Pie Charts + Donut Charts
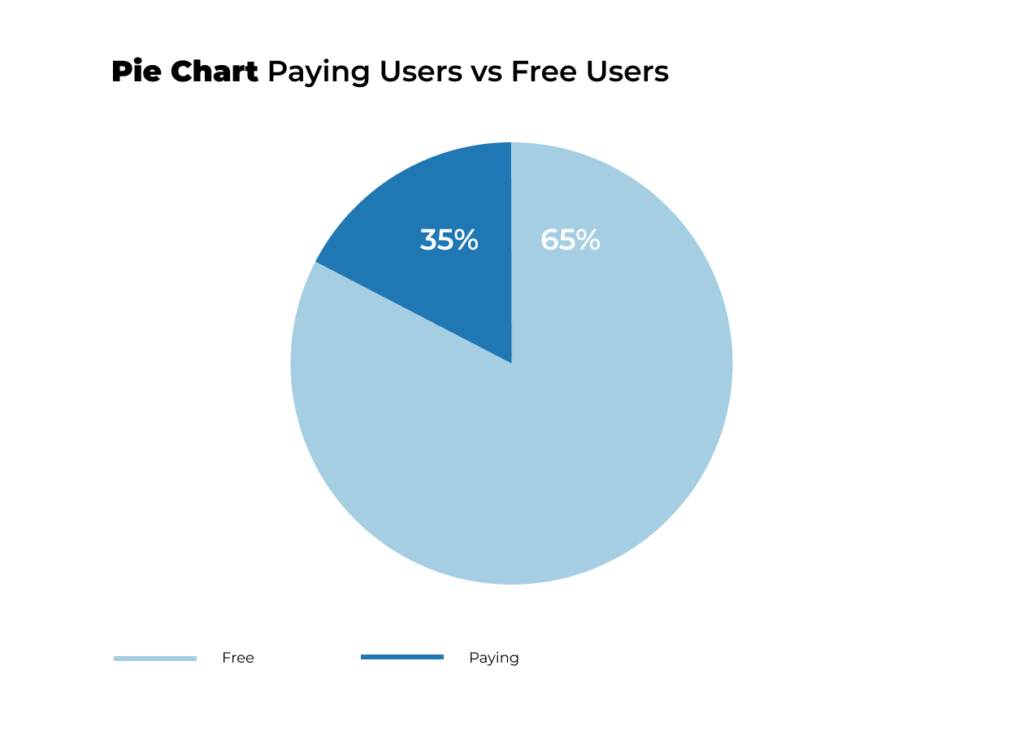
Pie charts are best used to display interrelated data–parts of a whole. To encourage readability, designers and data analysts recommend using pie charts to compare items across six categories or fewer. The simplified makeup of pie charts allows them to capture a viewer’s attention effectively and can add emphasis to a category’s relative importance (or unimportance).
Example: The percentage of paying users compared to the percentage of free users subscribed to ThinkNotesAI over the course of a year
→ Test your product management and data skills with this free Growth Skills Assessment Test.
→ Learn data-driven product management in Simulator by GoPractice.
→ Learn growth and realize the maximum potential of your product in Product Growth Simulator.
→ Learn to apply generative AI to create products and automate processes in Generative AI for Product Managers – Mini Simulator.
→ Learn AI/ML through practice by completing four projects around the most common AI problems in AI/ML Simulator for Product Managers.
Strengths:
- Especially useful for highlighting percentages and proportions
- Easy to understand and widely used
Weaknesses:
- Ineffective for comparing 5 or more categories
- Unsuitable for highlighting small difference between similar percentages
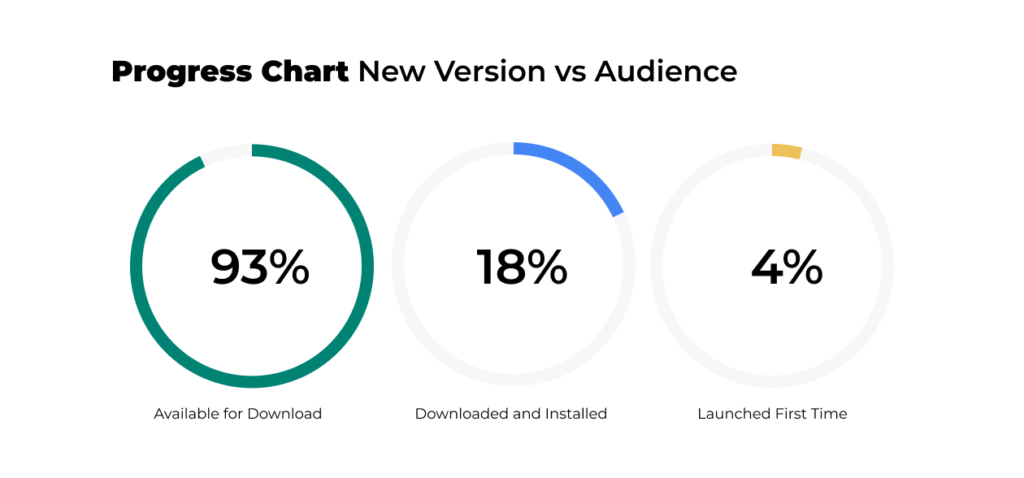
Progress (Bar) Chart
If your aim is to show progress against a single benchmark or KPI, consider using a progress chart. Because they’re visually oriented towards a single, discrete target , they’re useful for situations in which you’re looking to track milestones, and are popular choices for monthly or quarterly reports. Because of their shape, progress bars also take up less space than gauge charts, making them a good fit for busy dashboards.
Example: The share of users who switched to the newest app version
Strengths:
- Easy to interpret (commonly used for tracking achievements)
- Compact, highly accessible, easy to read
Weaknesses:
- Cannot show more than one metric at a time
- Unable to offer additional context alongside goals
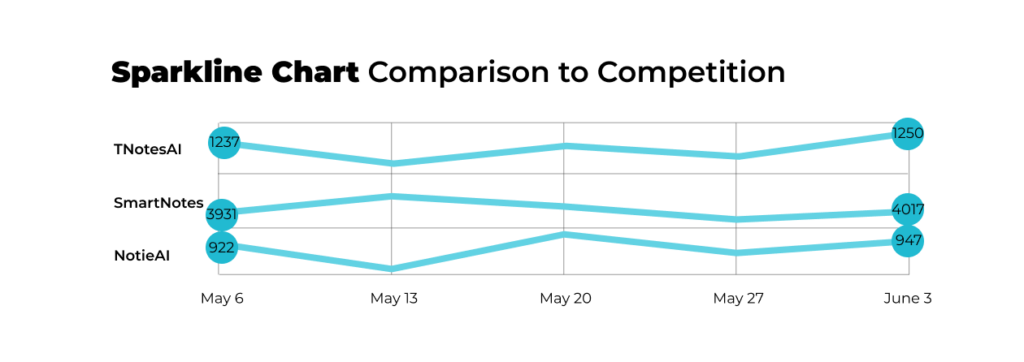
Sparkline Charts
A sparkline chart is a miniature line chart. Like line charts, they can be used to visually detect and share patterns, trends, spikes, and declines in a series of data over time. Because of their compact nature, they’re often used to highlight maximum or minimum values in a continuous series, and are sometimes used in line with text. Sparkline charts are minimal visualizations that don’t require tick marks or axis labels, so they’re best accompanied by text or other related content in presentations or dashboards.
Example: Weekly new user sign-ups at ThinkNotesAI compared to similar products.
Strengths:
- Compact in size; suitable for embedding in-line with text
- Enable quick and easy pattern detection
Weaknesses:
- Lack contextual information (including detailed axis labels and precise numerical values)
- Ineffective for comparing multiple datasets
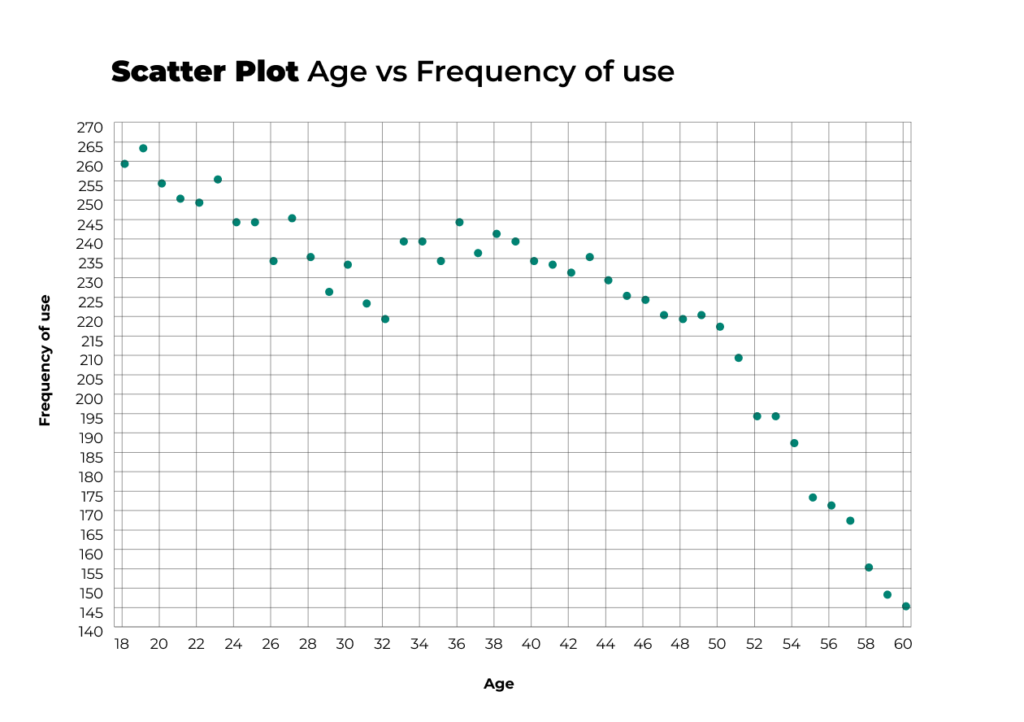
Scatter Plots
Scatter plots are best used for understanding the relationship between two quantitative variables. They’re also useful for showcasing the distribution of key data. Many scatter plots make use of trend lines, which allow viewers to understand the strength of a correlation between multiple sets of values at-a-glance. As such, scatter plots can be useful to show stakeholders the relationships between critical information and to locate anti-patterns; quantitative results that are common but ultimately undesired.
Example: AI features usage frequency related to user age within a cohort
Strengths:
- Excellent for showing relationships between two variables
- Useful for showing distribution of data
Weaknesses:
- May require statistical knowledge to interpret correctly
- Ineffective for comparing very few data points
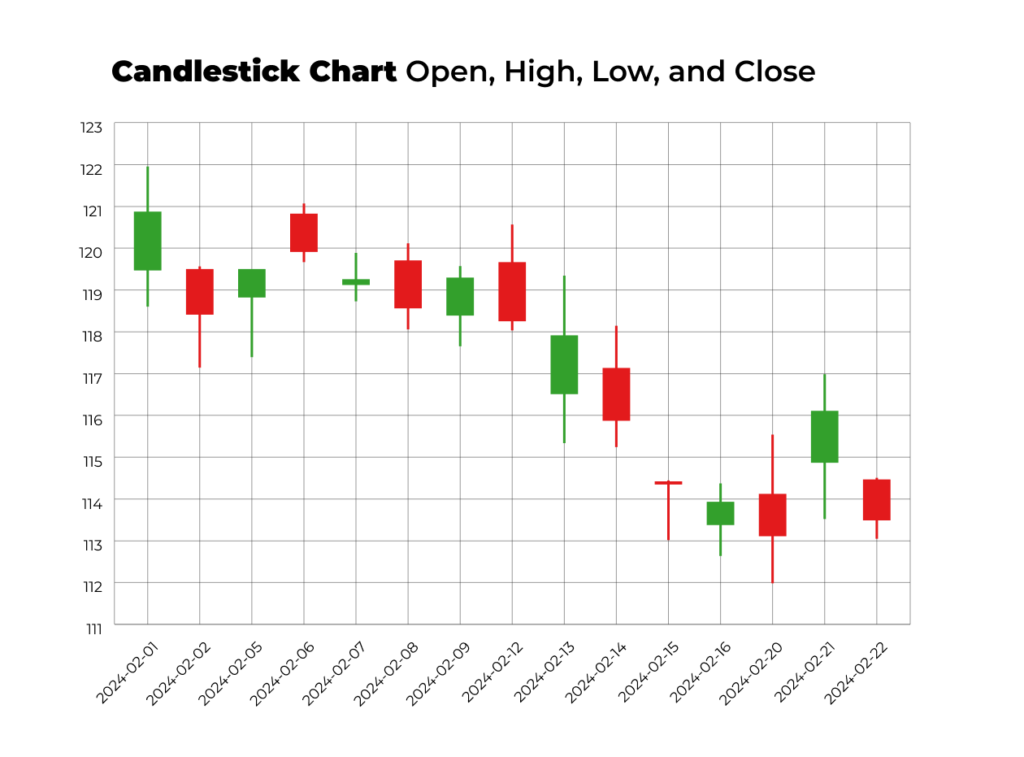
Candlestick Charts
Candlestick charts are specialized visualizations used to understand variations in price for financial asset classes including securities, derivatives, currencies, and more. Though they appear visually similar to box plots, they are specifically used to represent trading patterns over an established time period. Candlestick symbols include the open price, close price, highest price, and lowest price related to a particular asset. The color of the central rectangle of each symbol indicates to viewers (typically investors) whether the opening price or closing price was higher. Typically, green (or an unfilled rectangle) is used to indicate that an asset closed higher than it opened, and a filled rectangle is used to indicate it closed lower than it opened.
Example: The stock price for ThinkNotesAI’s parent company over the course of one month
Strengths:
- Useful for financial decision making
- Provides extensive price information in a compact manner
Weaknesses:
- Ineffective for displaying non-financial data
- Unable to convey volatility of trading
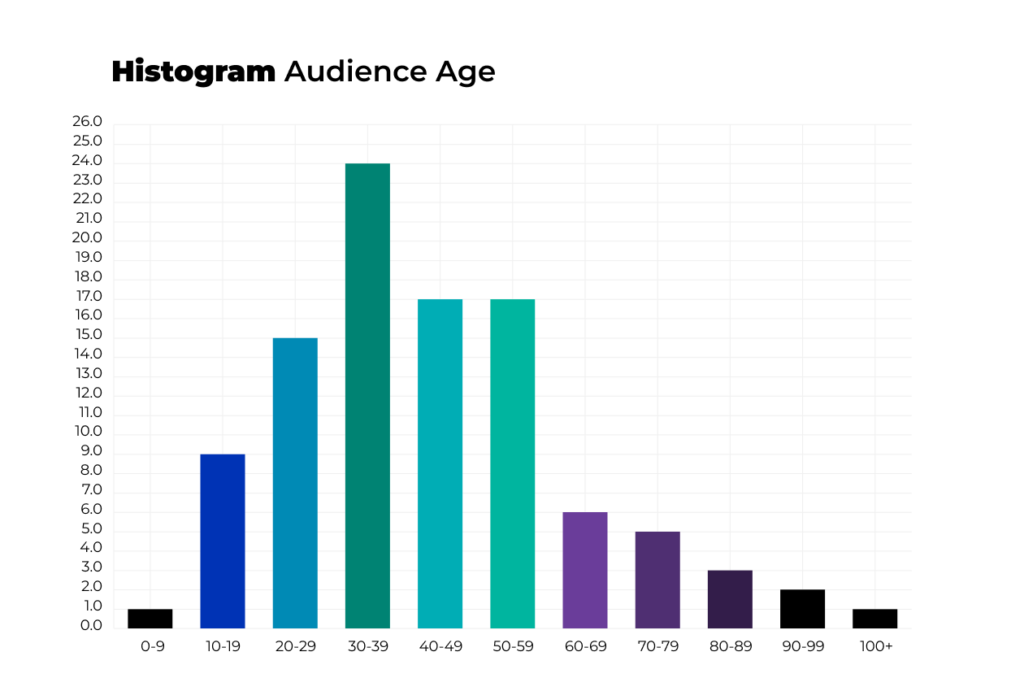
Histogram
While histograms are often confused with bar charts, they serve different purposes. Bar charts can be used to make various comparisons between categories, but histograms are specifically used to show the distribution of data within a series. In short, each bar in a bar graph represents a different category of data, while each bar in a histogram represents a count of how many data points fall into a designated range. These ranges are called “bins”, and are always shown in order from lowest to highest.
Example: The age distribution among the app’s audience
Strengths:
- Can support continuous, numerical data
- Able to clearly show central tendencies and averages
Weaknesses:
- Can be misleading based on the number and size of bins used
- Unable to show exact values
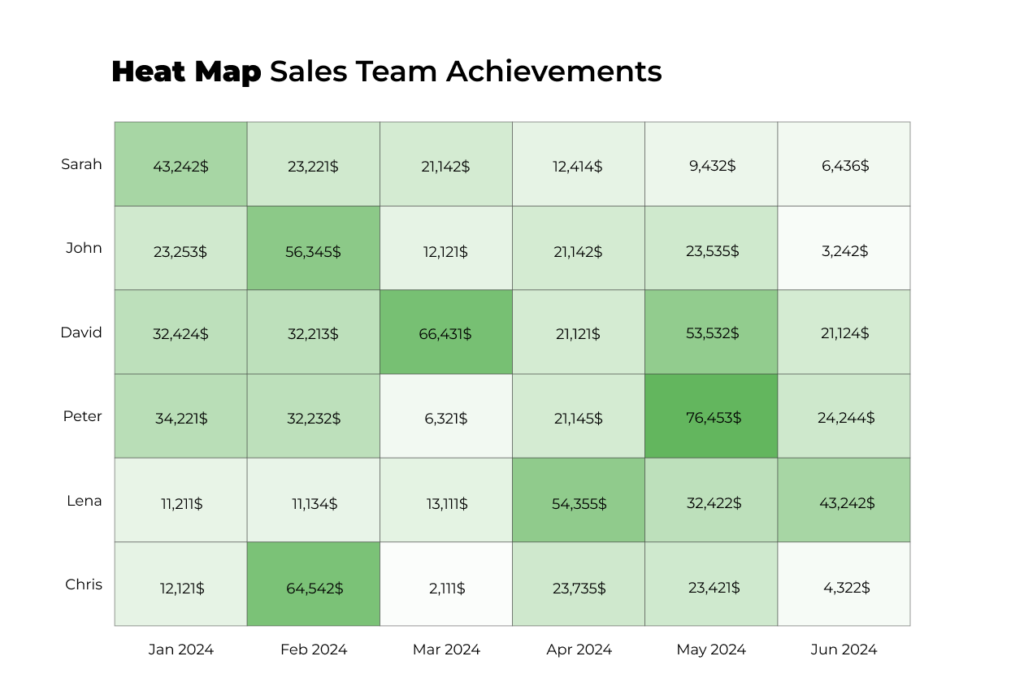
Heatmaps
Heatmaps are charts that compare values across dimensions and highlight patterns in density using color. They’re often used to highlight relationships between values and report on geographic trends, as they can be easily overlaid on parts of a map or cells within a table. They use the intensity of a color to reflect the magnitude of a particular value, which makes it easy to identify relationships between variables and high concentrations of certain values. Many designers will use a warm-to-cool color scheme that relies on warm colors to showcase areas of high density, hence the term “heatmap.”
Example: Sales team achievements at some B2B company
Strengths:
- Ideal for comparing values across two dimensions, especially locations
- Suited for suggesting correlations and highlighting relationships between information
Weaknesses:
- May require statistically knowledge to interpret effectively
- Accessibility is limited due to a reliance on color
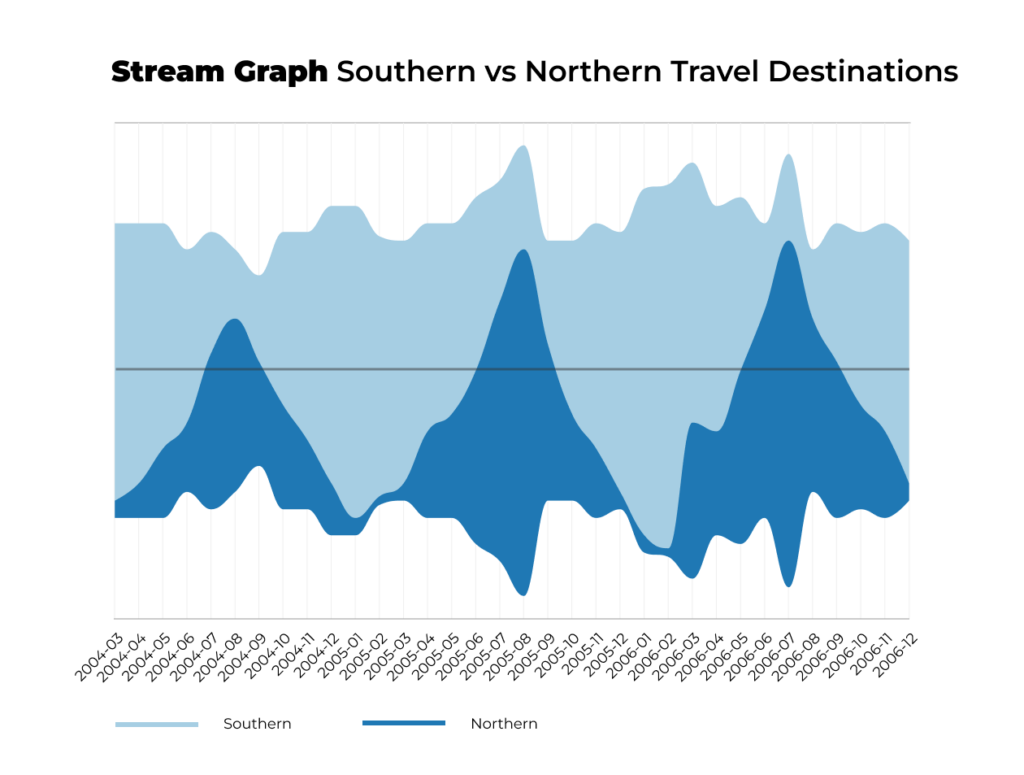
Stream Graph
Stream graphs are closely related to area charts and were developed by Lee Byron and Martin Wattenberg to display large datasets to non-technical audiences. Defined by their central axes and rounded edges, stream graphs showcase the relative proportions of groups compared to a whole. As such, they are often used to show periodic or seasonal patterns and other well-defined long-term trends. To build a stream graph, you may need to use specialized libraries such as those listed here.
Example: Ticket sales to southern and northern travel destinations depending on the time of year
Strengths:
- Great for showcasing general views of high-volume data
- Extremely effective as interactive visualizations
Weaknesses:
- Cannot display exact values
- Are unlikely to contain a value axis for reference
Illustration by Anna Golde for GoPractice