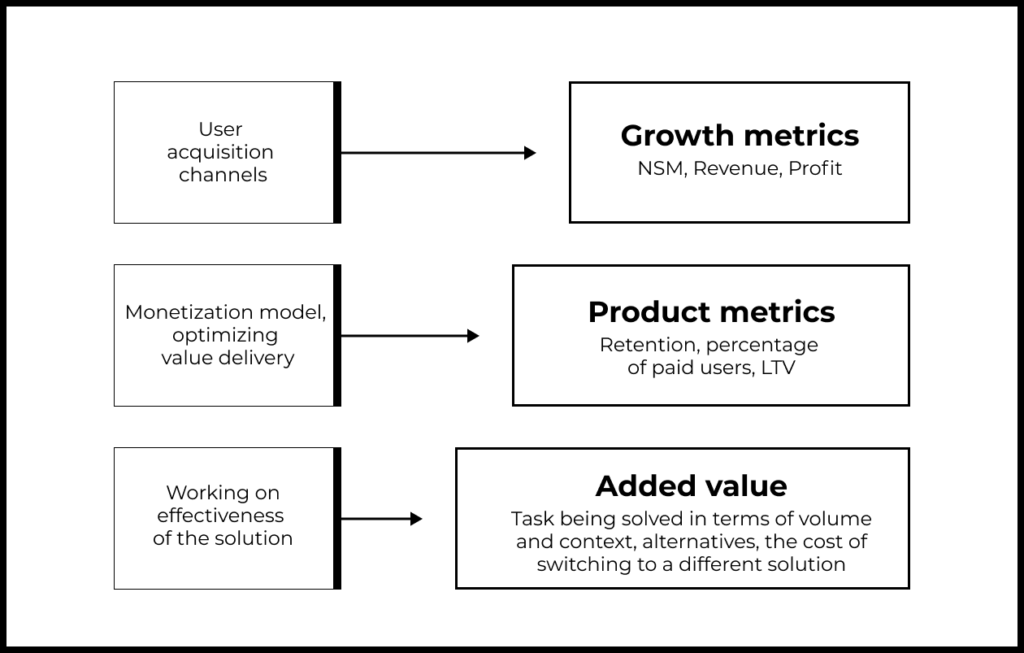
In the simulator we introduce two types of metrics: growth metrics and product metrics. These categories help students understand which metrics should be used in which situations.
- Product metrics answer questions about the product itself. They help you to understand how the product converts new users into active users, paying users, profit, orders, support requests, etc.
- Growth metrics answer questions about the business built around the product. These metrics include revenue, number of active users, number of orders or calls to support.
Over the past few years, I have noticed another type of metric: efficiency metrics or added value metrics.
In this essay, we will discuss what these metrics are, why they are needed, and why the product team should focus on them.
→ Test your product management and data skills with this free Growth Skills Assessment Test.
→ Learn data-driven product management in Simulator by GoPractice.
→ Learn growth and realize the maximum potential of your product in Product Growth Simulator.
→ Learn to apply generative AI to create products and automate processes in Generative AI for Product Managers – Mini Simulator.
→ Learn AI/ML through practice by completing four projects around the most common AI problems in AI/ML Simulator for Product Managers.
↓ All posts of the series:
→ Addressing user pain points vs solving user problems better.
→ Product manager skills: evolution of a PM role and its transformation.
→ Product metrics, growth metrics, and added value metrics.
→ Customer retention levers: task frequency and added value.
→ How to measure the added value of a product.
→ Should a product be 10 times better to achieve product/market fit?
→ Product/market fit can be weak or strong and can change over time.
→ Two types of product work: creating value and delivering value.
→ What is the difference between growth product manager, marketing manager, and core PM.
Product metrics
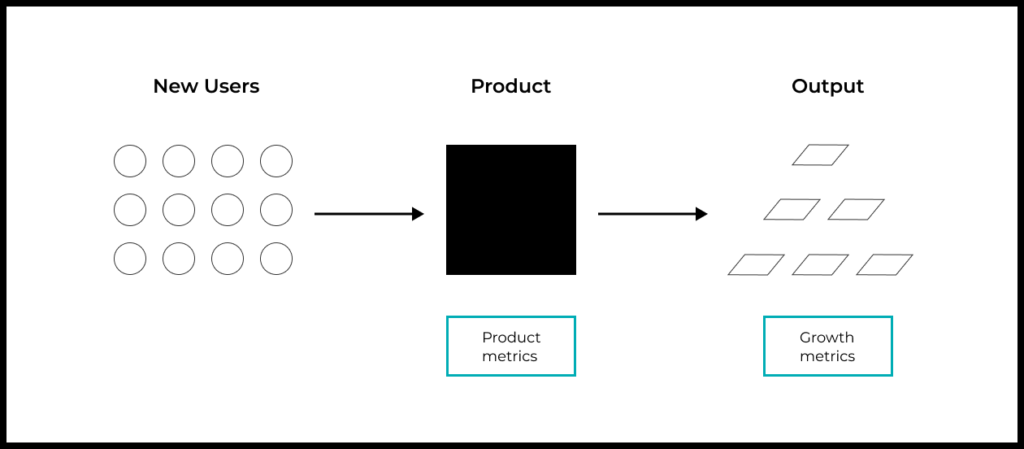
You can view any product as a black box that people use to solve their problems. New users are submitted as input to this box. The product processes them and turns them into active users, profit, support requests, etc.
Product metrics show how the product converts new users into other matters:
- Retention shows how the product converts new users into active users.
- Lifetime value (LTV) measures the profit that new users generate during the entire period of using the service.
- Purchase conversion shows how a product converts new users into paying customers.
Growth metrics
If product metrics describe the product itself, then growth metrics describe the business that is built around it.
Growth metrics are derived from product metrics and the number of new users, the main levers of influence on overall business growth.
Here are some examples of growth metrics:
- DAU or Daily Active Audience (New Users * Retention),
- Profit (new users * LTV)
- Number of users sending messages (new users * Retention into sending a message)
- Number of new subscribers (new users * Subscription conversion rate).
| Product Metric | New Users * Product Metric = | Growth Metric |
| Daily Retention | New Users * Daily Retention = | DAU |
| LTV | New Users * LTV = | Gross Profit |
| Retention into Sending a Message | New Users * Retention into Sending a Message = | Users Sending a Message |
| % of New Users Who Subscribe | New Users * % of New Users Who Subscribe = | Number of New Subscribers |
Why product metrics and growth metrics are not enough
In this essay, we analyzed in detail why it is impossible to use growth metrics when assessing the impact of product changes. Growth metrics depend both on product metrics and on the influx of new users. It is difficult to separate these factors from each other.
Therefore, in order to understand how the changes you made to the product affect user behavior, you need to use product metrics (Retention, LTV, etc).
But problems arise when teams begin to use product metrics not only as a tool to assess the impact of changes on user behavior, but also as a tool to prioritize projects for future development.
Let’s take a look at an example:
We want to increase the LTV of our marketplace users in order to get more users through paid acquisition channels.
↓
One of the levers of influence on LTV is Retention
↓
People come back to the app when we send them push notifications about promotions and sales.
↓
Therefore, we should do more promotions and send more push notifications.
↓
To improve Retention we should also add more triggers for users to return the product.
↓
For this, we can add social functionality for users to communicate with each other inside the app.
This, of course, is an exaggeration, but when you try to think about product development through product metrics alone, sooner or later, the product idea falls into such structures.
In the previous essay, we discussed why the job of a product manager is to improve the efficiency of the solution to the user’s problem. This is the main lever of influence on user behavior and, as by extension, on product metrics.
Why product metrics do not always explain the effectiveness of solving the user’s problem
A person evaluates a drug not based on how regularly and for how long it should be taken (product metrics), but on how quickly it can solve his health problem (efficiency metrics).
A user evaluates a dating app not based on its retention or paying conversion rate (product metrics). For the user, it is important which of the available dating apps provides faster and better dating opportunities (efficiency metric).
When a person evaluates two methods for training dogs, he doesn’t compare them based on how often they should be used. The dog owner cares about the result for the time spent training with each method.
Product metrics describe how people interact with a product. They should be used to understand how the changes made have affected user behavior.
At the same time, the main lever to influence user behavior is the increase in the efficiency of the solution to the problem. This usually means reducing the amount of effort that the user has to put in to fulfill their desired task.
To measure the effectiveness of the product from the user’s point of view, we will use problem-solving efficiency metrics. To compare the efficiency of a product with its alternatives, we will use added value metrics.
Efficiency metrics for solving the user’s problem: Added Value Metrics
Efficiency metrics measure the amount of effort and resources required to solve a user’s task (or achieve certain progress).
Added value metrics measure how one product is more effective than another (the difference in the efficiency metrics of two products).
These are high-level definitions. In future essays, we will analyze in detail the approach to the formation and calculation of efficiency and added value metrics. But for now, let’s look at a simple example.
Consider two financial products that help people earn passive income from the money invested in them. There are no differences between them, except for the annual interest rate:
- The first product brings 5% annually.
- The second product brings 10% annually.
In this case, the interest rate is an efficiency metric for each of the products. And the difference between interest rates is the added value of the second product relative to the first.
Added value metrics define the choice of solution
You may ask why we introduced the concept of added value.
When choosing a product to solve a problem, a person is not interested in its product efficiency metrics alone, but in how it compares to other solutions. That is why the focus of the product team should be precisely the added value relative to alternatives.
This added value is the main force that can attract people to the new product instead of the old one.
Product efficiency and added value metrics are task-specific, not product-specific
An important feature of product efficiency metrics is that they are based on people’s problems, not solutions. This means that the efficiency metric can be used for any product that solves the corresponding problem.
For example, the task of earning income on invested capital can be solved by deposits, shares, bonds, and real estate. Each of these products can be compared to others based on an efficiency metric expressed in expected annual return on invested capital.
You may argue that this metric does not fully reflect the effectiveness of solving the problem, since different investment products have different levels of risk. This is a fair statement, so in order to evaluate these products, we need to add one more parameter: risk level.
In future essays, we will discuss the issue of measuring the effectiveness of solving a problem and the added value in more depth.
Added value and product metrics are not always aligned
In most cases, the growth of added value improves product metrics: Retention, conversion to purchase, etc. After all, the greater the added value of a product, the higher the motivation to use it instead of alternatives, and the more often it is chosen when a task arises.
For this reason, product teams that work solely through the lens of product metrics can still be quite effective.
But product metrics and efficiency metrics are not always aligned. Let’s look at two examples where product and product efficiency metrics move in different directions.
Example 1: Shovel for digging a trench
- You are working on a “shovel” product.
- Your target users “hire” the shovel to dig a trench.
- With the current version of the shovel, it takes 10 days to complete this task. As a result, Retention drops rapidly after day 10 (the task of digging a trench does not occur very often for users).
- The product team prioritizes and evaluates its work using product metrics, specifically through retention.
- As part of one of the sprints, the team launches an experiment where they reduce the size of a shovel bucket.
- Consequently, Retention for the shovel grows for the next cohort of users. But this is because with the new version of the shovel, digging a trench takes 15 days.
- Here, the product metric has grown, but the efficiency of solving user problems has dropped.
- This is an exaggerated example, but product teams often do similar things, they just don’t know or see the real effect of the decisions they make on the life of the end user.
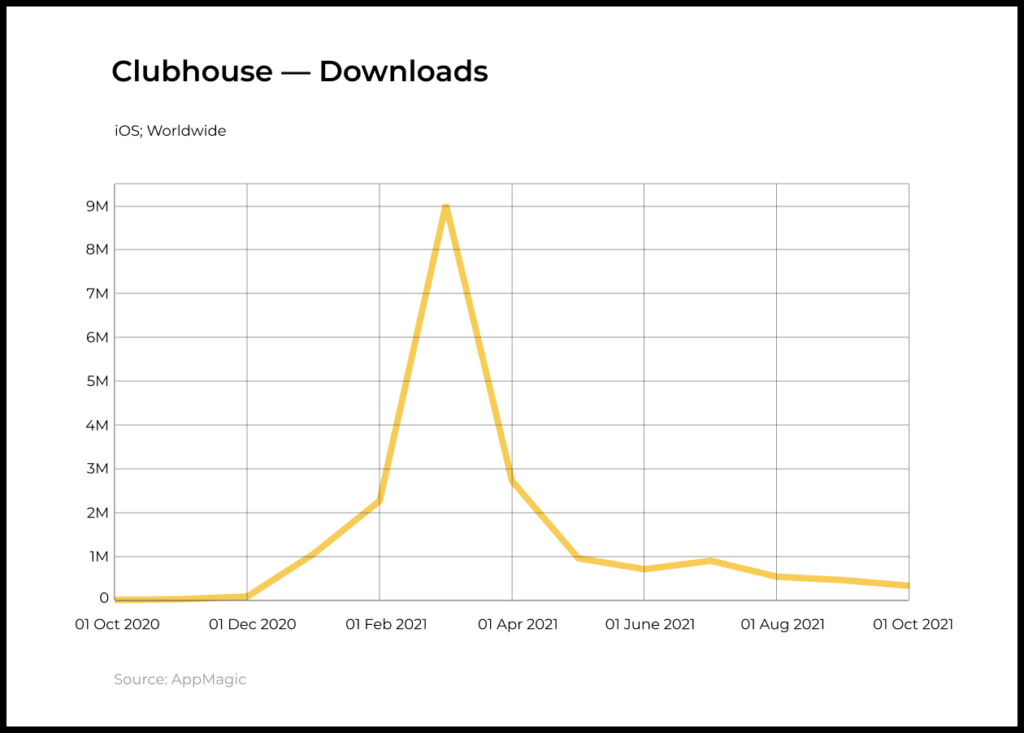
Example 2: Clubhouse chat app
- Clubhouse is a mobile app for live audio group chats. Several speakers discuss a topic of choice, and other users listen to the discussion and can participate by using the “raise hand” feature.
- Let’s assume that the service solves an entertaining and educational use case: to have a good time, learn new and interesting things.
- Immediately after the launch, Clubhouse used an invite-only registration model. The service team or existing users could invite new users to the service. The presence of such a barrier obviously spoiled both the activation of new users and Retention (product metrics). Many users found out about Clubhouse through word of mouth and downloaded the app but couldn’t use it because they weren’t invited (activation and Retention opportunities were missed).
- But on the other hand, this mechanism made it possible to maximize the efficiency of the product. Among the first users of Clubhouse were well-known investors, entrepreneurs, authors, scientists, and other figures (Elon Musk, Naval Ravikant, Marc Andreessen, and Ben Horowitz). Their conversations on various topics were very interesting and deep, and contained many insights (high efficiency).
- The invite-based mechanism ensured the high quality of the first members of the community, which then brought more interesting users to Clubhouse, which again increased the efficiency of solving users’ tasks.
- Thus, while the invitation mechanism degraded Clubhouse’s product metrics, it increased the efficiency metrics.
- A year after the launch, Clubhouse began to scale rapidly and gradually removed the invitation barrier. This increased the activation and retention of new users in the short term, but diluted the quality of the community. As a result, many of the interesting users left, which reduced the value of conversations on Clubhouse (efficiency of solving the problem).
Added value metrics define product metrics
In ordinary life, we are quite good at feeling and understanding which product best solves our problem. For example, you know which employee is best at a particular job, which sneakers are best for running, and which analytics tool will allow you to answer a question faster.
But problems arise when we start making products for others and start thinking in terms of features, roadmaps, conversions, competitors, trends, product metrics. However, the end users are concerned about the same simple question: how to solve their problem more efficiently (faster, cheaper, easier).
Added value metrics allow you to look at the product through the eyes of the user. They answer the question of how efficiently our product solves a problem compared to other known and available alternatives.
That is why added value is the most important metric in product management work:
- If the product does not create added value relative to alternatives, then the user will not be motivated to try and continue to use it. Sure, you can win users over with marketing tactics, but you can’t keep them long-term.
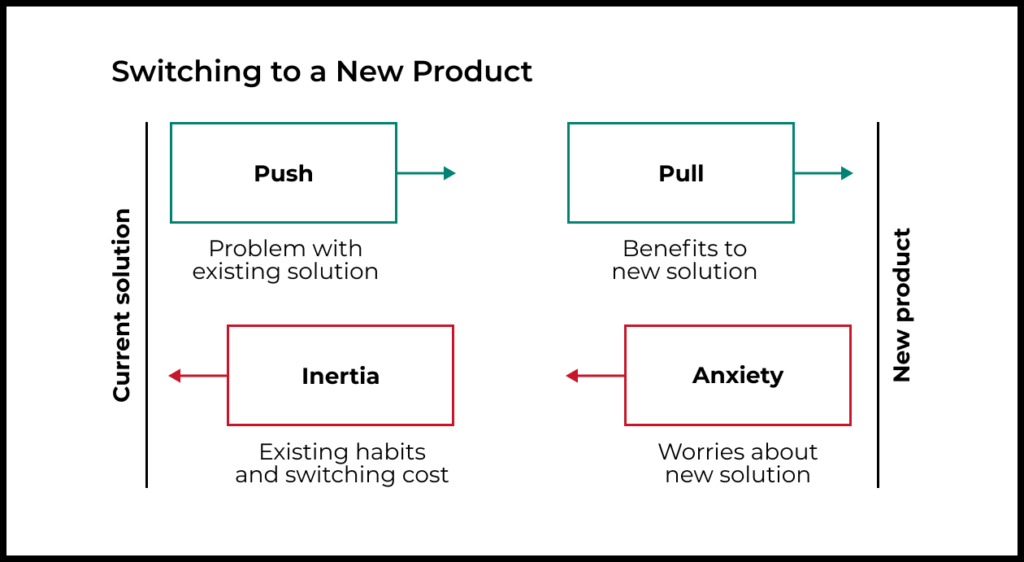
- If the product creates added value relative to the current way of solving the problem and the added value is enough to overcome the inertia, laziness, and fears of users, then they will choose your product to solve their problems.
Added value metrics define product metrics, which in turn define growth metrics. That is why the work of a product manager should be carried out at the level of efficiency in solving the user’s problem.