
It’s a competitive world out there. To win over users, products have to contend with the alternatives already on the market.
There are ways of measuring audience size, revenue, and downloads for competing apps so that you get a better understanding of the situation and market trends. With these tools, you can adjust your growth strategy and find benchmarks for key metrics for products similar to yours.
In this article, we will look at the tools that can help you to do this. Special emphasis will go to those available for free.
→ Test your product management and data skills with this free Growth Skills Assessment Test.
→ Learn data-driven product management in Simulator by GoPractice.
→ Learn growth and realize the maximum potential of your product in Product Growth Simulator.
→ Learn to apply generative AI to create products and automate processes in Generative AI for Product Managers – Mini Simulator.
→ Learn AI/ML through practice by completing four projects around the most common AI problems in AI/ML Simulator for Product Managers.
Contents
- How to measure app income and downloads
- How to learn sources of ad traffic and where competitors are advertising
- Where to find a competitor’s ad creatives
- Comparing keyword rankings, plus what about ASO
- How to find out an app’s retention and DAU/MAU
How to find out app revenue and downloads
Let’s talk about ways to learn how much money a competitor’s app is bringing in.
This information isn’t publicly available, of course. But there are special services that will provide an estimate for a given app. The catch is that these estimates are usually paywalled.
Sites offering estimates of mobile app revenue include:
- SensorTower
- MobileAction
- AppMagic (paid version only)
- Data.ai (paid version only)
- Appfigures (paid version only)
How to view a competitor’s revenues and downloads in SensorTower
You’ll need a paid account to access historical app data on SensorTower. But in most cases, information for the last month is enough to make a rough guess, and you don’t even need to sign up to access this. Simply visit app.sensortower.com and enter an app name. The number of downloads and revenue estimate will appear as a pop-up suggestion.
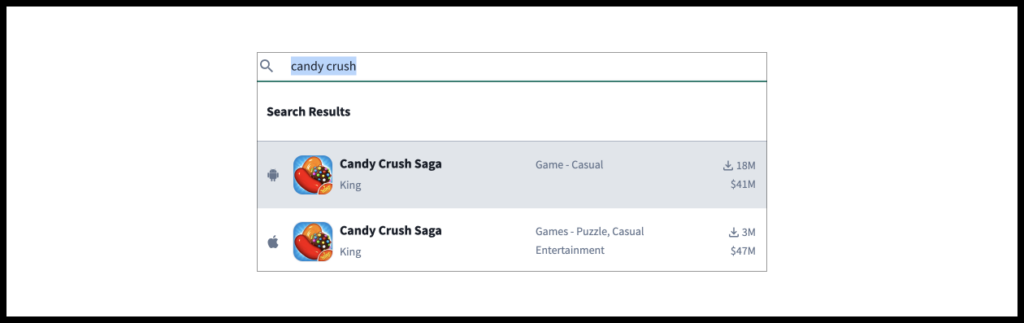
How to view a competitor’s revenues and downloads in Mobile Action
Here you can view the number of downloads and approximate revenue for an app during the previous month. Note that you can view data only for one specific country and platform (iOS or Android) at a time. You can toggle these in your search. But you can’t get combined numbers covering both platforms or all countries.
Also note that after you sign up with Mobile Action, you can no longer view app data. Data can be viewed only prior to sign-up (or by opening the site in an incognito browser window).
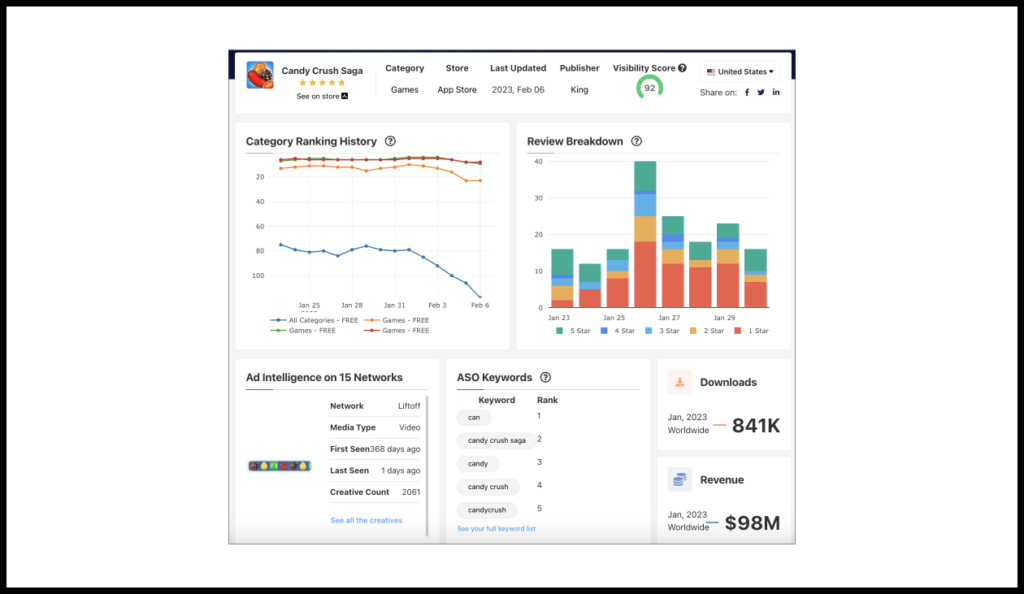
AppMagic
Shelling out for the paid version will give you access to more features and more precise estimates of app revenue and downloads.
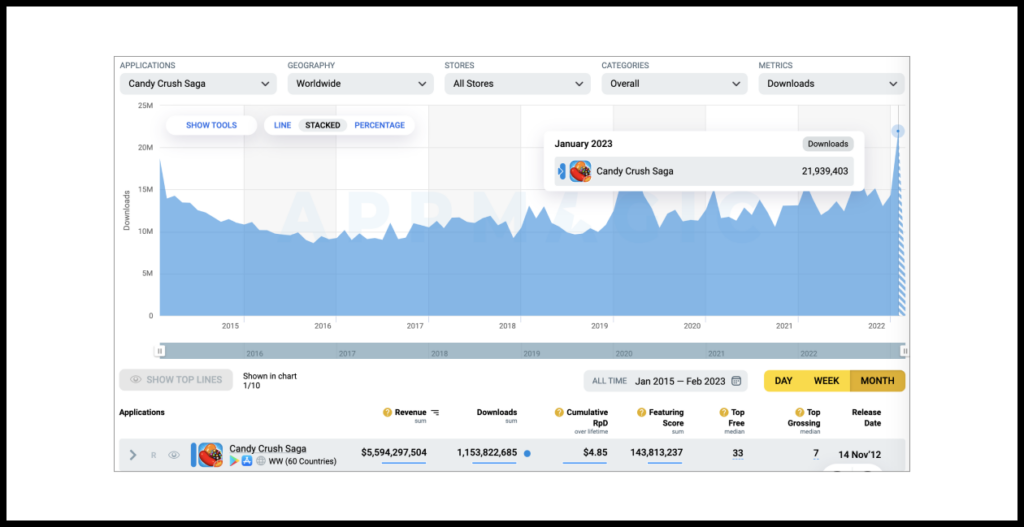
Just take a look at the dashboard for Candy Crush Saga with AppMagic, for example:
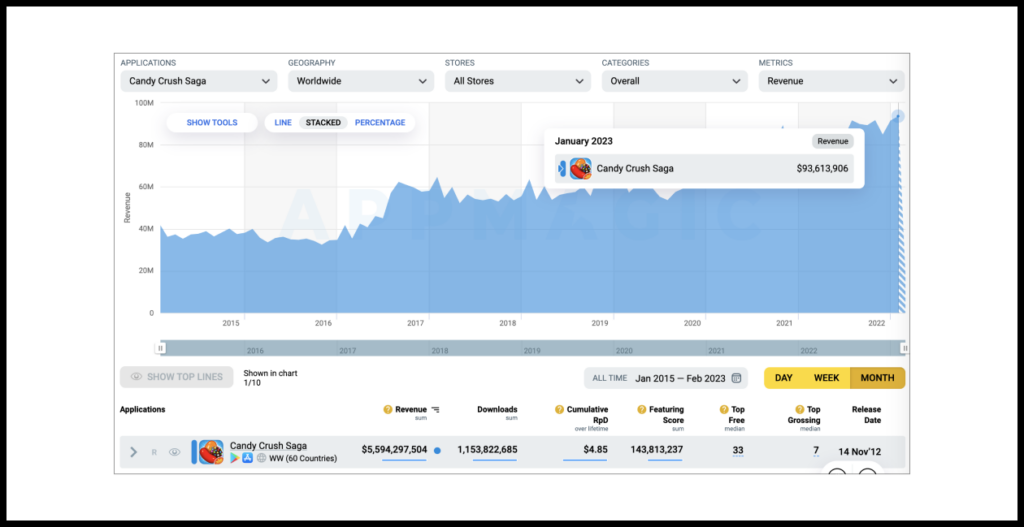
Dig deeper and you can view month-by-month data for both revenue and downloads:
Data.ai
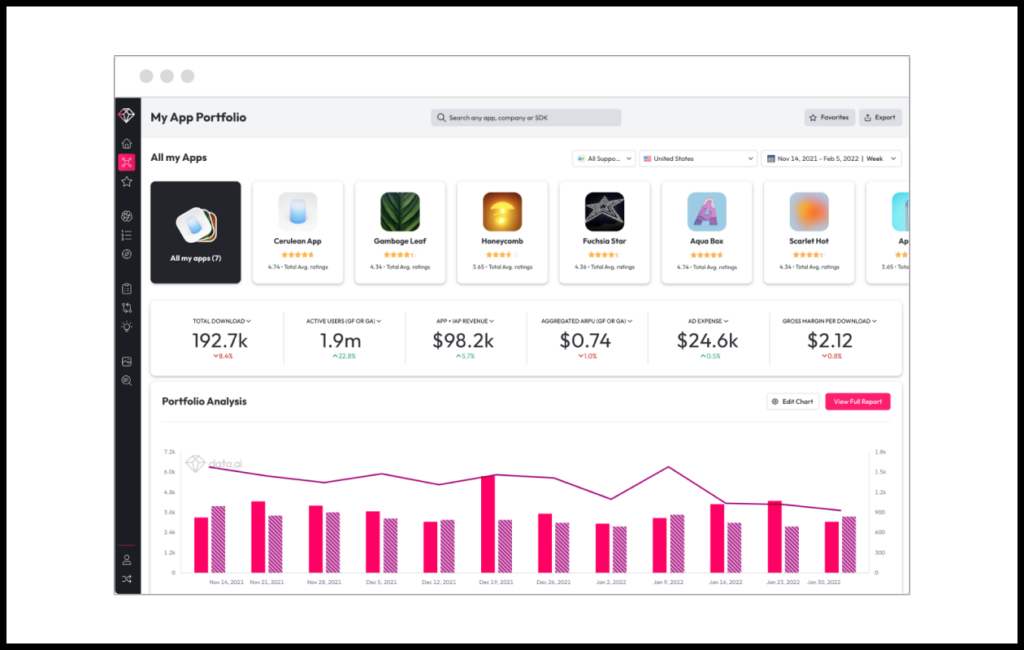
This is how the Data.ai dashboard looks.
You can view downloads, revenue, ad spend, and other metrics:
Others
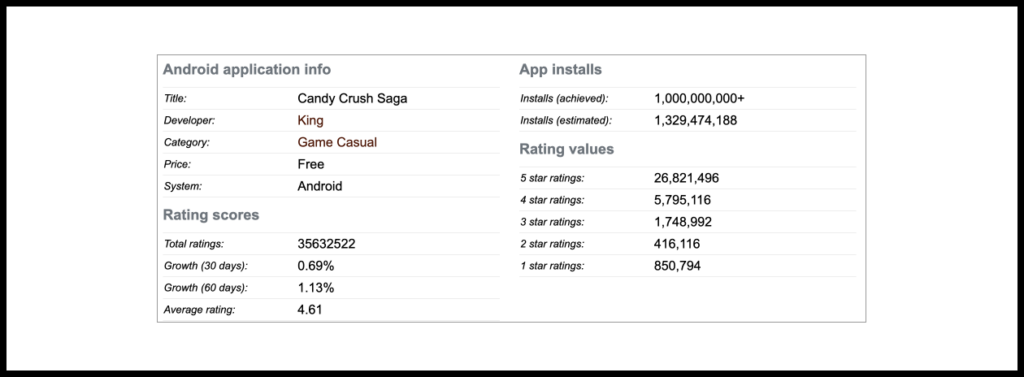
For Android apps, you can try out the free Android Rank, which estimates app installs.
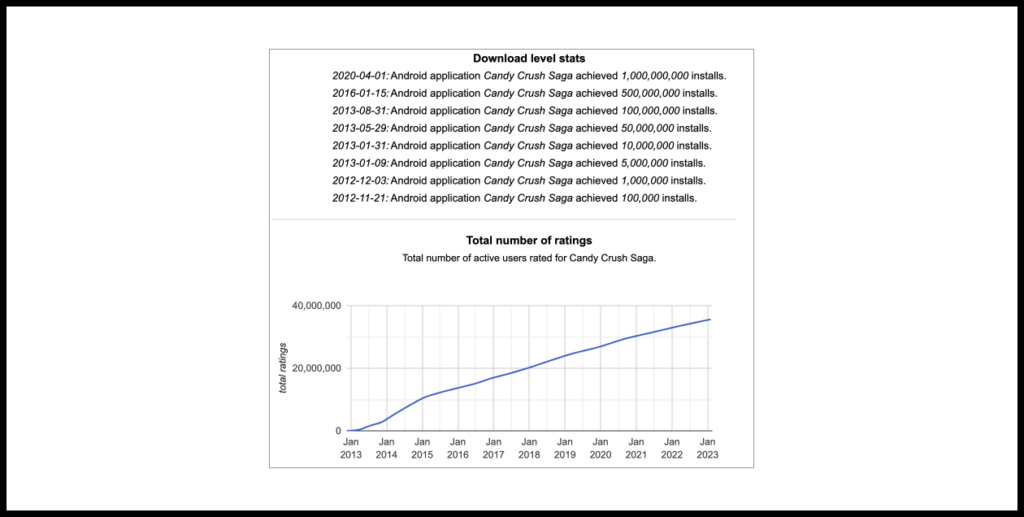
Another option is to get historical data about when an app’s install count grew beyond a certain threshold.
How to learn sources of app traffic
The simplest way to figure out the sources of users to an app’s site or store page is Similarweb.
Currently this works only for Android apps, however.
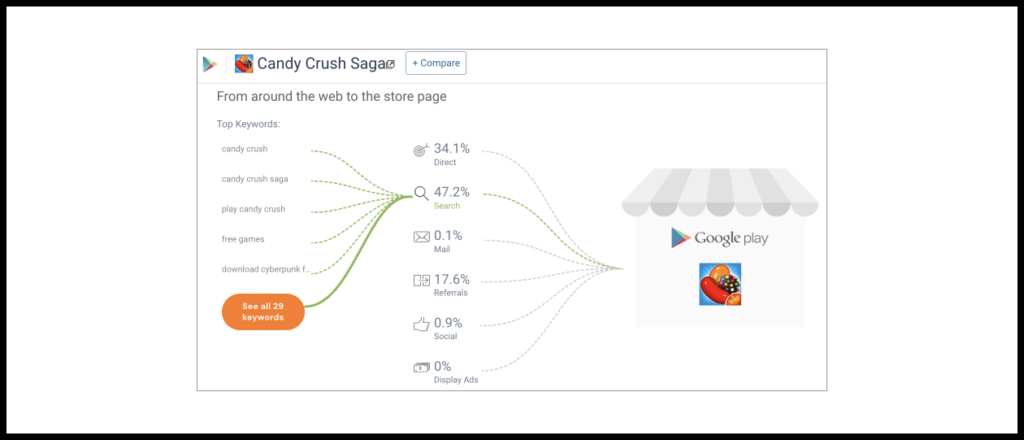
On the left, you’ll also find the keywords driving traffic to the app’s Google Play page from Google search results. Similarweb does not provide data on searches performed within Google Play.
Alas, we wouldn’t place a lot of confidence in the information provided. As one example, looking at Candy Crush Saga in the above screenshot, both the lack of ad traffic and large number of searches for “Cyberpunk” seem hard to believe.
Other sites offer extremely limited information to non-paying users. For instance, SensorTower will show only whether the app has ads in rotation, without indicating which ad network. The paid version of Sensor Tower, in the Ad Intelligence section, will include historical data about app ad campaigns.
How to find where an app is buying ads and which creatives it uses
MobileAction
After signing up with MobileAction, select an app you want to find out about. On the left, click the Ad tab. Then go to Creative Analysis.
MobileAction will show the ad’s nine most recent ad creatives and the ad network where they were found.
Breakdowns by country, time, and ad networks are available in the paid version only.
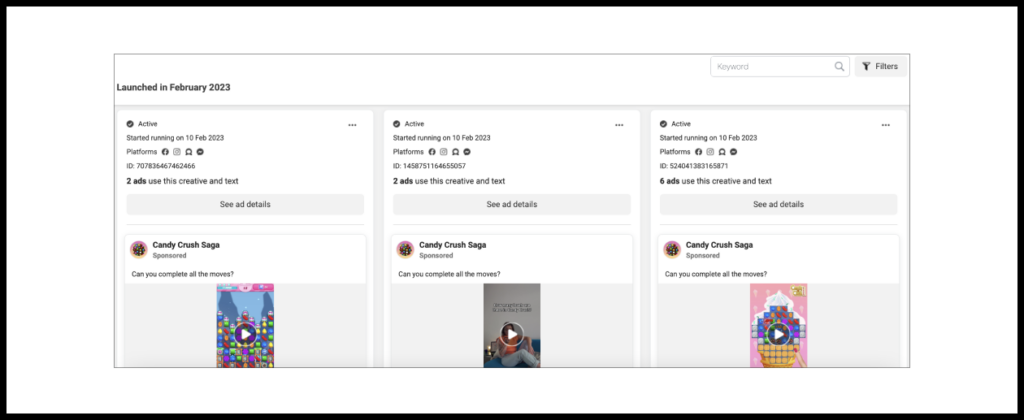
Meta Ad Library
This is a free source listing the ad creatives on rotation in Meta products (Facebook, Instagram, Messenger).
You can search worldwide or by country.
Search for an app of interest to see the latest creatives for it.
You can even filter by ad keywords.
Premium products
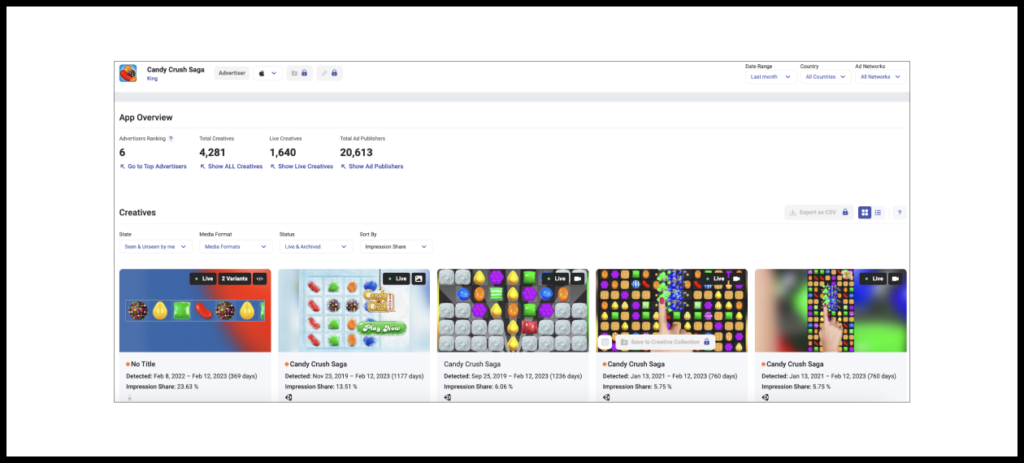
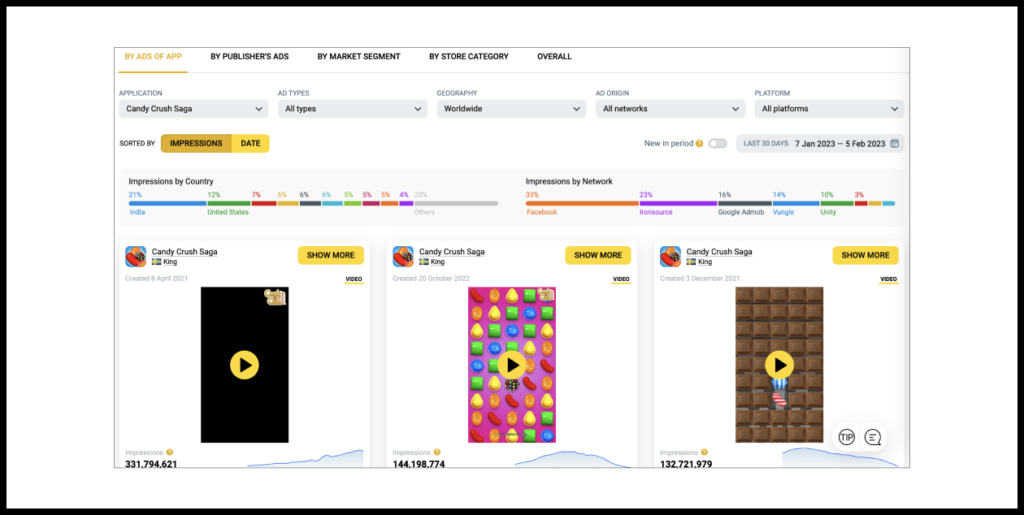
Ad Intelligence features are included with a subscription to platforms like AppMagic and SensorTower.
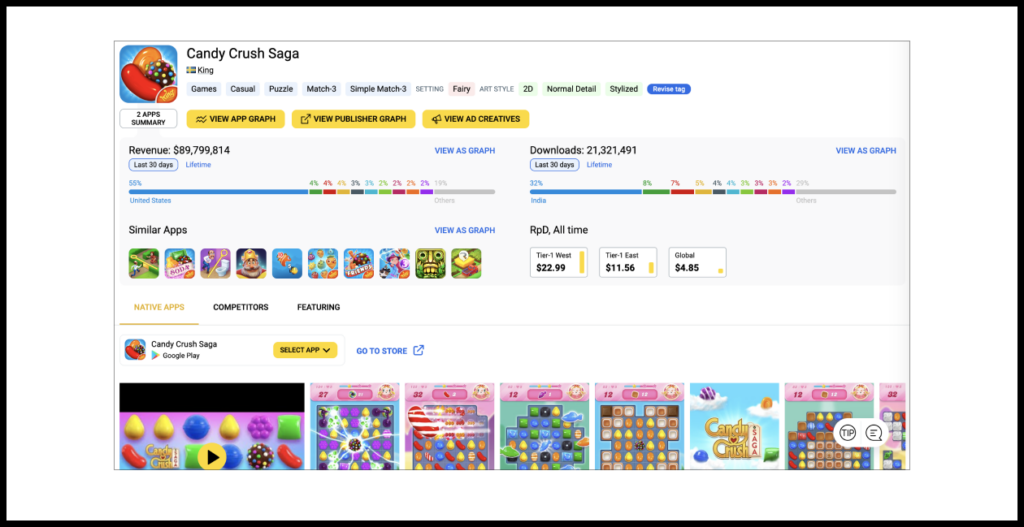
So for AppMagic, you can drill down by ad impressions per country and ad network during a specified period. You can view total impressions for each creative.
The example below shows creatives for Candy Crush Saga during the last 30 days, sorted by popularity.
Paid subscriptions on other sites work in much the same way.
ASO (App Store Search Optimization) and keyword rankings
For many mobile apps, most traffic comes from app stores. People find apps via search, recommendation mechanisms, showcase features, etc.
You can get a leg up on keyword rankings for apps on Apple’s App Store and Google Play, ASO (App Store Search Optimization), positions on store charts, and featured positions for your own mobile apps and those of your competitors by using:
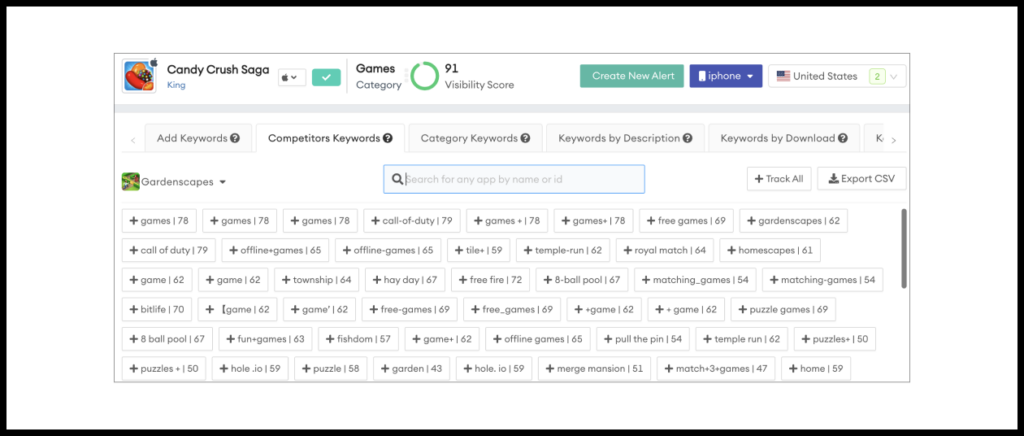
MobileAction
The free version offers several methods for analyzing ASO.
One way is to view the keywords that bring users to competing apps.
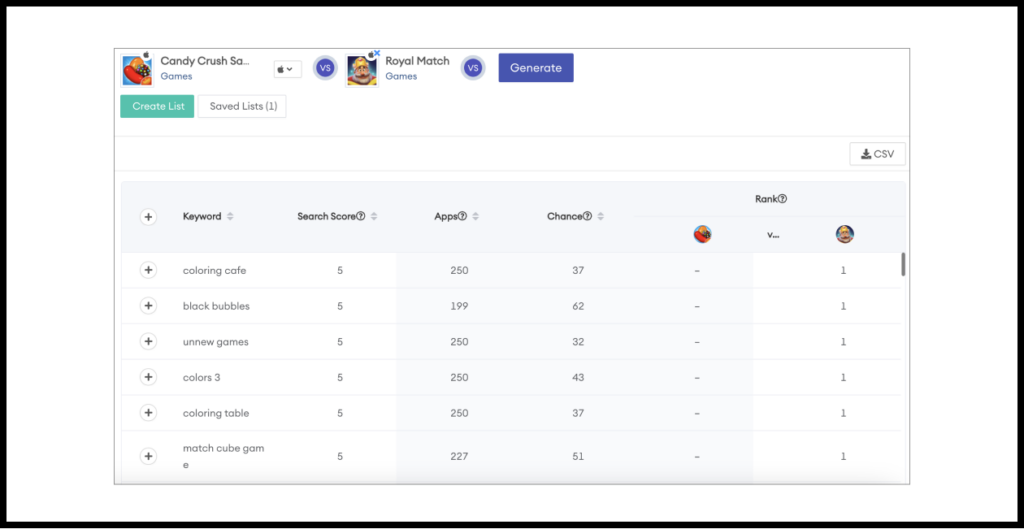
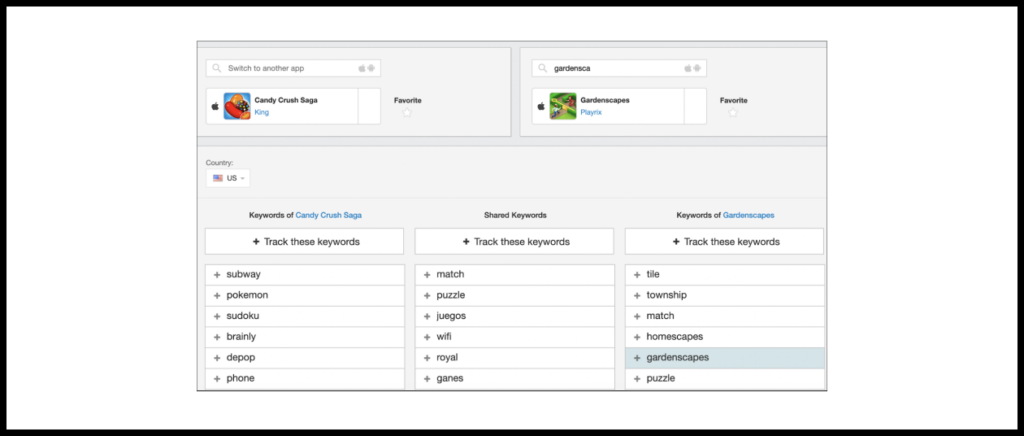
You can also pick one or more competitor apps for comparison. Try to identify keywords for which they place high and your app doesn’t appear anywhere.
Other features include words that are currently trending on the store and foreign-language translations of keywords.
SensorTower
The free version of SensorTower is rather limited. After just a few searches, you will get a warning that your limit will run out soon.
SensorTower’s ASO functionality is par for the course, with features like keyword optimization and comparison with competitors’ keywords.
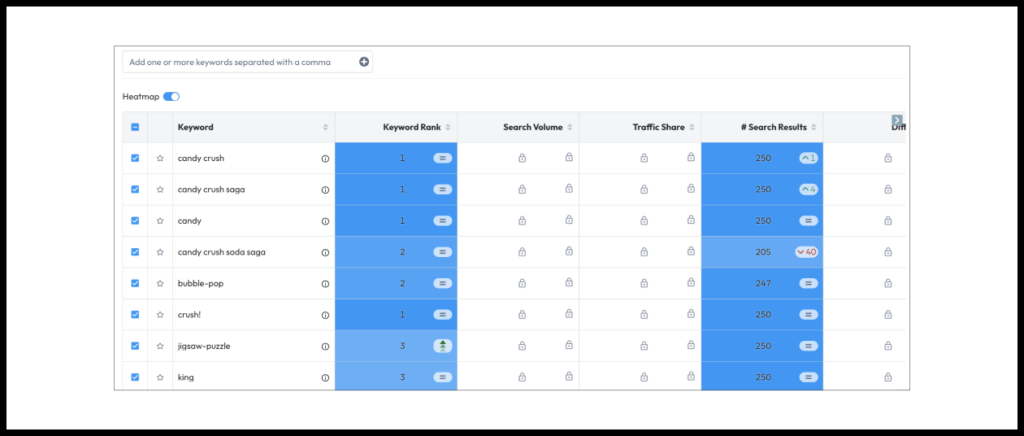
Data.ai
The free version of Data.ai will tell you the main keywords for which a given app is high in store search results.
Data.ai shows changes for specific keywords over time, as well as any new keywords. In the screenshot, you can see that although Candy Crush did not show up anywhere in the App Store results for “jigsaw-puzzle” in December, it jumped up to “Rank 3” in January.
Retention and DAU/MAU
All popular services hide app-specific retention and DAU/MAU information behind a paywall (if you are aware of any free sources, drop us a note at the email address below).
Let’s have a look at what popular services can offer in the way of app retention and audience.
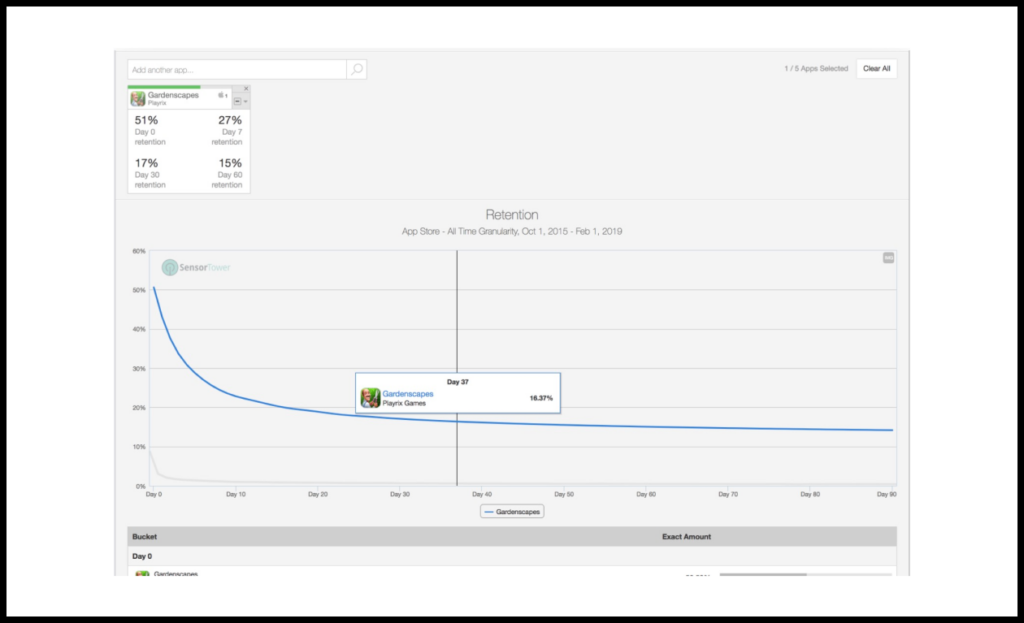
SensorTower
Under Usage Intelligence, you can view average retention for a defined period in a given store:
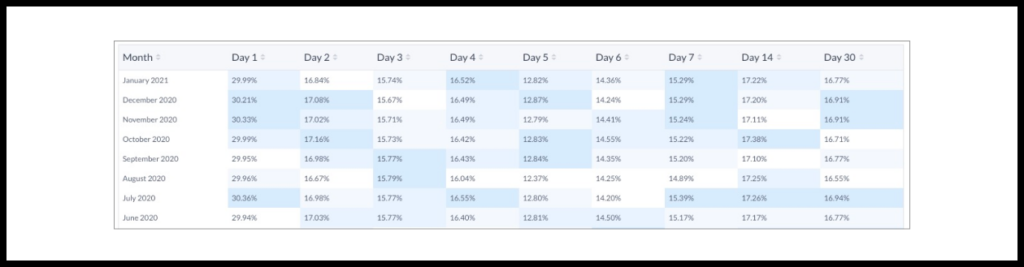
Apptopia
Apptopia provides a rather detailed report about an app’s average retention during a selected month.
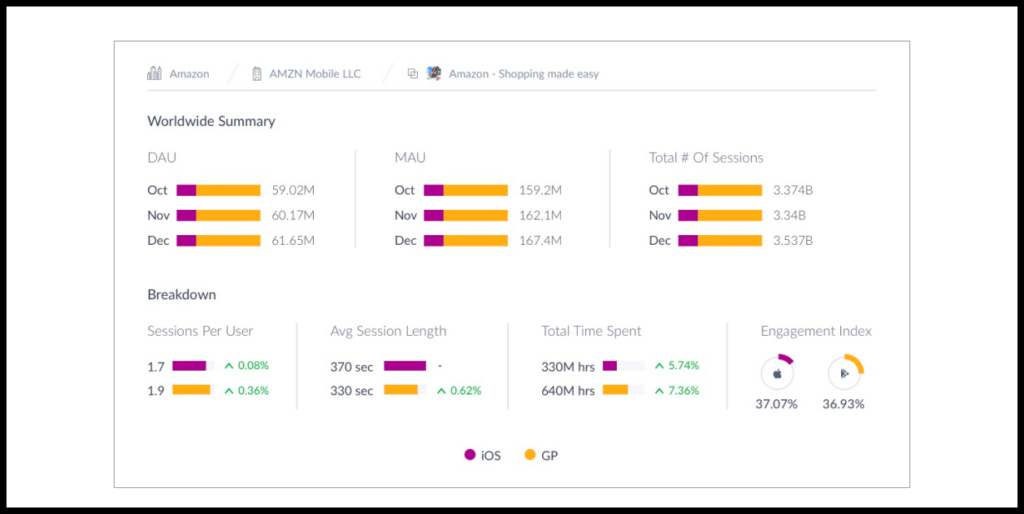
As for audience metrics, Apptopia provides metrics including but not limited to DAU, MAU, and total monthly sessions.
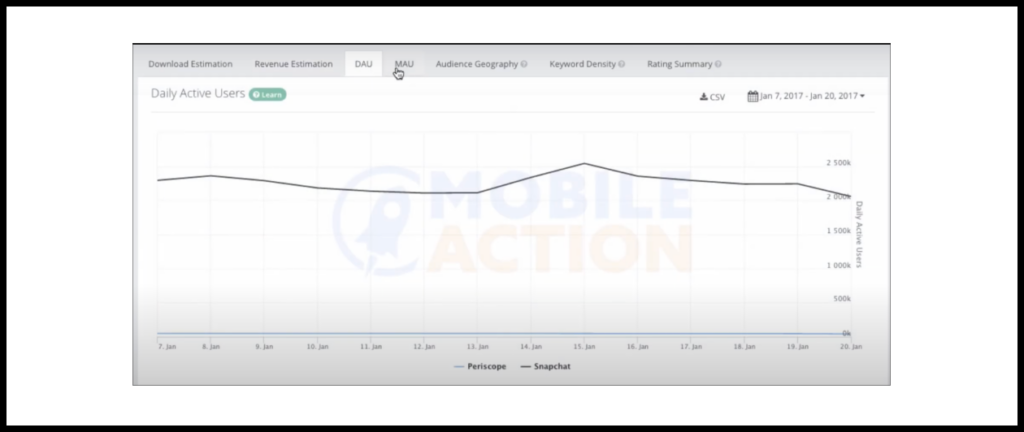
MobileAction
View changes in estimated DAU and MAU over time for selected apps.
Data.ai
You can also try Data.ai for getting an app’s retention as well as daily and monthly audience. Based on the subjective experience of people we know who have tried this their service, Data.ai tends to provide the most accurate estimates.