
Data-driven decision-making is essential for success in product management. And one of the important parts of any kind of data-driven work is measuring and understanding central tendencies in data samples.
Central tendencies refer to the typical or average values of a set of data points, and they can provide insights into the overall performance of your product. Measuring central tendencies is becoming increasingly important in any kind of decision-making that involves data. And product managers have to make decisions based on data on a daily basis.
There are several ways to measure central tendencies, but the most commonly used methods are arithmetic mean and median. In this article, we will explore these two measures, compare them, and see how they can be used in product work.
→ Test your product management and data skills with this free Growth Skills Assessment Test.
→ Learn data-driven product management in Simulator by GoPractice.
→ Learn growth and realize the maximum potential of your product in Product Growth Simulator.
→ Learn to apply generative AI to create products and automate processes in Generative AI for Product Managers – Mini Simulator.
→ Learn AI/ML through practice by completing four projects around the most common AI problems in AI/ML Simulator for Product Managers.
Arithmetic mean
Arithmetic mean is a widely used measure of central tendency in data analysis. It is calculated by adding up all the values in a dataset and then dividing the sum by the total number of values. The formula for arithmetic mean is as follows:
Arithmetic Mean = (Sum of all values) / (Total number of values)
For example, let’s say you are a product manager for an e-commerce website and you want to calculate the average shopping basket value of the previous day. You would first collect data on all the purchases during that time frame. Here is an example:
Arithmetic Mean = ($45 + $32 + $56 + $78 + $23) / 5 = $46.80
Strengths of arithmetic mean in product management
- The formula for the arithmetic mean is easy to understand and calculate, making it accessible and useful for communicating data insights to stakeholders, such as executives or development teams, who may not have a strong statistical background.
- The arithmetic mean takes all values in the dataset into account.
- The arithmetic mean is a familiar and intuitive metric that is widely used in many fields. It allows for easy comparison between different datasets and can provide a quick snapshot of overall performance.
Weaknesses of arithmetic mean in product management
- The arithmetic mean is highly sensitive to outliers, data points that are significantly different from the rest of the dataset, either much larger or much smaller. Outliers can skew the mean upward or downward, giving an inaccurate representation of the data’s central tendency. In product management, this can lead to misguided decisions or missed opportunities.
For example, let’s say a product manager is analyzing the average time users spend on their e-learning platform. Most users spend around 30 minutes on the platform, but there are a few outliers who spend over five hours. If the product manager were to solely rely on the arithmetic mean, they would get a much higher value than the typical user’s experience. - Arithmetic mean can be expensive to compute for very large datasets. Adding up all the values in a dataset can be time-consuming, and for datasets with millions of data points, it may not be feasible to calculate the mean by hand.
Use cases for arithmetic mean in product management
In product management, the arithmetic mean is a useful tool to use when you want a simple, intuitive metric that represents the overall average or typical value across a set of numbers that don’t have too many outliers.
One example of when to use the arithmetic mean in product management is when calculating customer satisfaction scores. By using the mean, you can give equal weight to all scores, providing an overall average satisfaction rating that can be used to track changes in customer perception over time.
Another example is when calculating the cost per install for a mobile app. By calculating the mean cost per conversion, you can get a quick snapshot of the app’s overall cost-effectiveness across many conversions. This can be useful in identifying areas for improvement, optimizing ad spend, and enhancing the overall user acquisition strategy.
Median
The median is a measure of central tendency that represents the middle value of a dataset when arranged in order from smallest to largest. It’s a useful tool for analyzing data when there are outliers or extreme values that may skew the arithmetic mean.
To calculate the median, you first need to arrange the values in the dataset from smallest to largest. If the dataset has an odd number of values, the median is the middle value. For example, if the dataset is {3, 7, 12, 16, 19}, the median would be 12, as it’s the middle value. If the dataset has an even number of values, the median is the average of the two middle values. For example, if the dataset is {4, 6, 10, 13, 18, 22}, the median would be (10 + 13) / 2 = 11.5.
Strengths of median in product management
- The median is less sensitive to outliers than the arithmetic mean. It is more robust and not impacted by a few extreme values. In product management, this can be especially useful when analyzing data that contain extreme values that may not be representative of the overall dataset. For example, if a product manager is analyzing the prices of products in an online store and there are a few very expensive items, the median would provide a more accurate representation of the central tendency of the data.
- The median is easier to compute for large datasets, especially if the underlying database is indexed and sorted properly. This can be useful for product managers who need to analyze large amounts of data quickly and efficiently. For example, if a product manager is analyzing the response times of a website with millions of users, finding the median response time would be a faster and more efficient way to analyze the data than calculating the arithmetic mean.
Weaknesses of median in product management
- The median can be counterintuitive to people who are less familiar with statistics. This can make it more difficult to communicate data insights to stakeholders who may not have a strong statistical background.
- The median ignores some values in the dataset, focusing only on the central value. This can be problematic in certain contexts where it’s important to consider all values in the dataset.
- The median alone does not provide any information about the spread of the data or how variable the values are.
For example, consider a product manager who is analyzing time spent on the product by users. If the product manager solely relies on the median, they may overlook valuable insights about the distribution of user engagement. For example, if the median time spent on the product is 10 minutes, this may suggest that the product is engaging for most users. However, the median alone does not provide any information about how many users spend very little or very long amounts of time on the product, or how engagement varies by user demographics or behavior. This information is important for identifying areas for improving the product.
Use cases for median in product management
In general, the median is a useful tool for metrics where extreme values could skew the meaning of the arithmetic mean. This is especially important when outliers or extreme values can have a significant impact on measuring product performance and user experience.
One example of when to use the median in product management is when analyzing revenue per customer. By using the median revenue per customer instead of the arithmetic mean, the product manager can get a more representative central revenue amount for a typical customer, without being impacted by a small number of very high-value customers. This can be important for making reliable forecasts for the product’s revenue.
How to choose between arithmetic mean and median
Here are a few guidelines to decide whether the arithmetic mean or the median is a better choice for your use case:
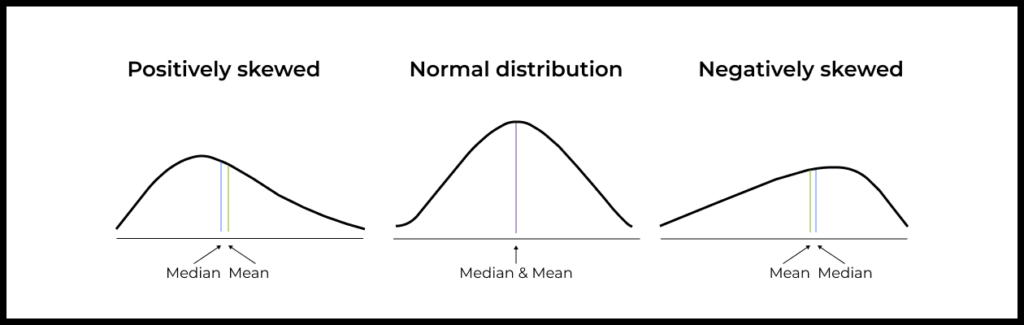
- Data distribution: If your data is normally distributed, the arithmetic mean is a good measure of central tendency. However, if your data is skewed or has outliers, the median may be a better choice.
- The purpose and context of your analysis: The choice between the mean and median may depend on the specific context of your analysis. For example, when considering salaries of a survey’s respondents, the median salary may be more relevant than the mean salary because it represents the typical salary of the population. However, if you’re doing a survey of the weights of the user’s of a health app, the mean might be more suitable.
- Sample size: If you have a small sample size, the median may be a better choice because it is less sensitive to outliers. However, if you have a large sample size, the arithmetic mean is often more precise.
Using the arithmetic mean and median together
In some cases, using both the mean and median together can provide a more complete picture of the central tendency of a dataset. By analyzing both metrics, product managers can better understand the distribution of values and identify any outliers or extreme values that may be impacting the data.
For example, if a product manager is analyzing the time it takes for users to complete a task within an app, using both the mean and median together can be helpful. If the mean time is significantly higher than the median time, this may suggest that a small number of users are taking much longer to complete the task and may be experiencing usability or design issues. By analyzing both metrics, the product manager can identify these outliers and take steps to address them, while still having a clear understanding of the typical user experience.
As data becomes increasingly important in product work, it’s crucial for product managers to have a solid understanding of statistical concepts and measures of central tendency, such as the mean and median. By effectively using these metrics, product managers can make decisions that are based on a more complete and accurate understanding of the product.