
As product managers, we regularly use percentages in different ways to measure different metrics. But despite their intuitive simplicity, percentages have different nuances that can make them confusing or misleading if used improperly.
In this article, we’ll discuss percentages, percentage points, and percentiles, along with their uses in product management along with best practices and pitfalls to avoid.
→ Test your product management and data skills with this free Growth Skills Assessment Test.
→ Learn data-driven product management in Simulator by GoPractice.
→ Learn growth and realize the maximum potential of your product in Product Growth Simulator.
→ Learn to apply generative AI to create products and automate processes in Generative AI for Product Managers – Mini Simulator.
→ Learn AI/ML through practice by completing four projects around the most common AI problems in AI/ML Simulator for Product Managers.
Percentages and percentage points in product management
Percentages are a way of expressing a part of a whole as a fraction of 100. For example, if 25 out of 100 users make a purchase on a website, the conversion rate is 25%.
Percentages are useful for measuring growth or change over time, as they allow you to compare the current value of a metric to a baseline value.
Percentage points, on the other hand, refer to the difference between two percentages. For example, if the conversion rate on a website increases from 20% to 25%, the difference is 5 percentage points. Percentage points are useful for measuring the magnitude of a change, as they provide a clearer picture of how much a metric has changed over time.
Meanwhile, you can also use percent to track the relative difference between two measurements. Going back to the previous example, if the conversion rate on your website increases from 20% to 25%, you have witnessed a 25% increase in conversion rate. This is calculated with the following formula:
100 / 20 * (25 – 20) = 25%
Each of the above measures shows a different picture of the product. And depending on what matters, you might want to use one or all of them.
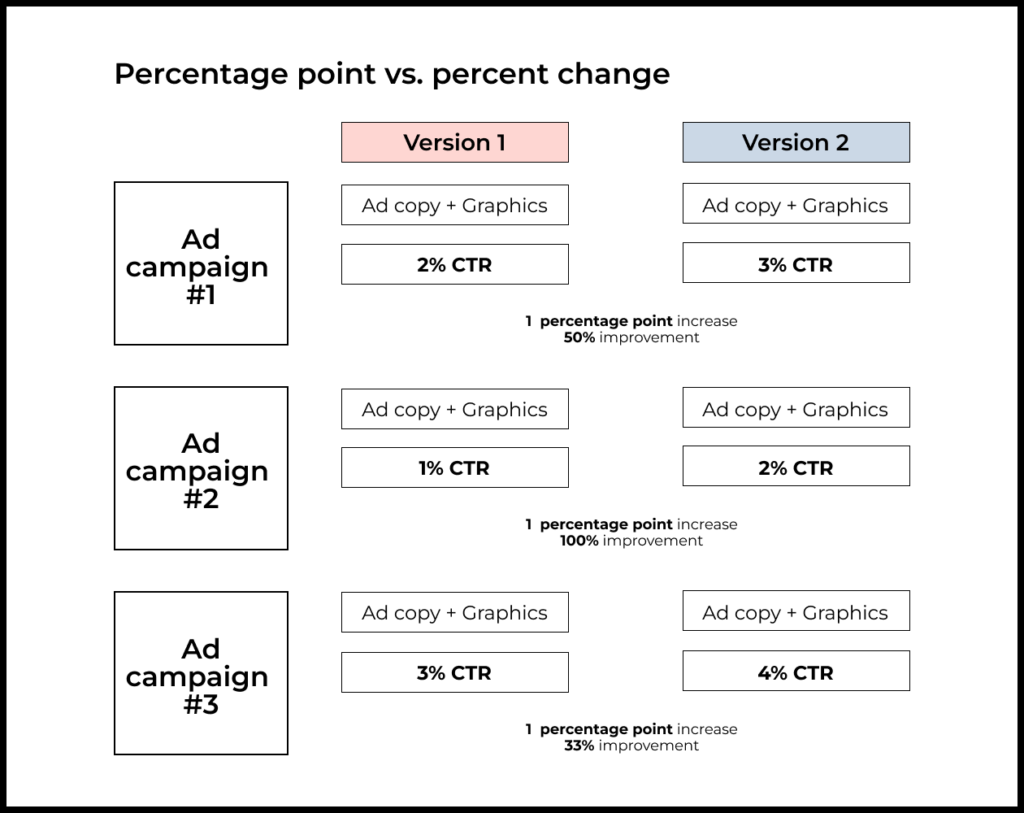
For example, say you’re running an ad campaign and want to track the click-through rate of different ads.
You run an initial version of the ad and present it to 1,000 users. Out of all the users who saw the ad, 20 click on it. So you start with a 2% click-through rate (CTR).
You decide to try a different version of the ad by changing the background color. You run another 1,000 impressions of the ad. This time, 30 users click on the ad. Now you have a 3% CTR.
In this case, you have managed to improve the ad’s CTR by 1 percentage point, which might not seem much. However, if you look at it from a relative perspective, you have managed to improve CTR by 50%. When you’re running millions of ads per day, then a 50% improvement in CTR will make a huge difference.
Pitfalls of using percentage and percentage points
In some cases, the wrong use of percentages can give a misleading impression. Say you have an online service with an uptime of 96%. Thanks to some changes in your IT system, you manage to improve availability by 2 percentage points to 98%. The IT department reports that they have managed to cut downtime by 50%. In reality, you are still having around 175 hours of downtime per year, which is not good.
When using percentage points, make sure to understand the metric they represent and the impact of changes to that metric.
Percentiles in product management
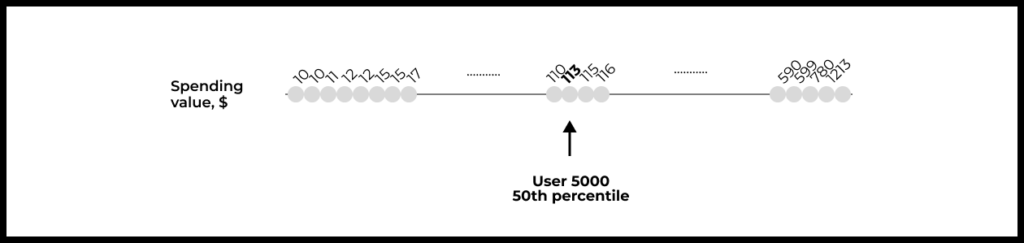
Percentiles are a way of dividing a data set into 100 equal parts, with each part representing a percentile. Percentiles are useful for understanding the distribution of a metric and identifying outliers or trends within a specific segment of users.
For example, say your e-commerce app has 10,000 active users in the past month and you’re tracking their spending inside the app. The 50th percentile would represent the value under which 5,000 users spend on your app. The 50th percentile is also known as the median.
When working with percentiles, you might also hear the term quartile, which refers to 25% parts of the data. The first quartile refers to the 25th percentile, the second quartile refers to the 50th percentile, and so on.
How else can you utilize percentiles in product work?
For instance, when analyzing website load time, you can shift the focus away from the arithmetic mean or the median and instead measure the index using percentiles. Let’s consider the 95th percentile for website load time, which is 1.5 seconds. This implies that 95% of users load the website in 1.5 seconds or less, while the remaining 5% experience longer load times. In this context, the 5th percentile might be 1.2 seconds, for instance. This indicates that 5% of users have download times equal to or less than that value.
In the aforementioned example, the 95th percentile enables you to exclude the “outliers” in the data originating from a small fraction of users who might have encountered issues affecting their download speed. Using the arithmetic mean would heavily skew the result towards an increase, and the median would not provide an understanding of the typical experience for the majority of users.

Pitfalls of using percentiles
While percentiles can provide valuable insights into the distribution of a metric and help identify outliers or trends within specific segments of users, there are some challenges to using them in product management.
For example, if you’re measuring user engagement, percentiles may not tell you whether users are engaging with your product in a meaningful way or just spending a lot of time on it without taking any significant actions.
The distribution of a metric can change over time, which may make it challenging to compare percentiles across different periods. For example, if you’re measuring user retention, the distribution of retention rates may change as your product evolves or as market conditions change, making it difficult to compare retention rates across different time periods.
Finally, the accuracy of percentiles can be affected by the quality of your data and the size of your sample. If you have a small sample size or incomplete data, your percentiles may not accurately reflect the distribution of your metric.
How to choose your metrics
Percentages, percentage points, and percentiles are important measurements that you will use regularly in product work. Understanding their nuances is key to knowing how to use them best. Ultimately, you’ll want to keep a few things in mind when using these measurements:
- What metric you are tracking and what other ways can you measure it?
- How does your metric change over time and whether these changes can confound your measurements?
- Do you have enough data to provide an adequate sample size for measuring percentages and percentiles?
- Does your metric have a certain minimum threshold that you must meet?