
In this article, we will explore how product managers can effectively use the outcomes of qualitative research.
Information obtained during interviews can help product managers and their collaborators better understand users and their needs. However, in order to use qualitative data effectively, it’s important to:
— Select the right technique for processing interviews (and related data);
— Draw accurate conclusions based on interviews (and related data).
Systematically analyzing in-depth interviews can help product managers identify trends, collaborate with stakeholders, and reduce subjective risk.
This guide is a result of our collaboration with experienced researchers:
Interview objectives
In-depth interviews provide valuable opportunities for product managers to better understand their users’ needs, habits, problems, and expectations.
By gaining a detailed understanding of their users, product managers can identify common trends and patterns in user behavior (and important edge cases).
With this information, PMs can test their product hypotheses more effectively, and adapt their products to serve users’ most pressing needs. In some cases, research outcomes might lead a product manager to decide to discontinue a product or feature altogether.
If you’re unsure how to prepare and conduct in-depth interviews, check out “Qualitative research in product management: the guide”. Once you’re finished, you can return to this article.
Here, we’ll discuss why it’s important to analyze the results you’ve obtained from qualitative research, and how to do so.
Analyzing qualitative data
Objectives of analyzing qualitative research results
- Identify common trends
Reviewing research outcomes can help you understand important themes, trends, tendencies, and patterns in user behavior. Generating research summaries makes it easy to identify which problems users face while using the product, and which they face more generally. By establishing a baseline for user behavior, you can distinguish between urgent and non-urgent problems and identify opportunities for new feature development. This way, you’ll be empowered to solve problems that require immediate attention while working towards your product’s vision.
- Reduce subjectivity risk
It’s impossible to completely eliminate our own influence on (and perception of) respondents and their contributions. That said, working systemically with the interview data you’ve collected will enable you to reduce the “observer effect.” By analyzing and synthesizing qualitative data with care, you can understand it more objectively and schematically.
- Focus on the key goals of the research
During the data collection stage of a qualitative research project, it’s possible to gather a lot of interesting information that may spark new ideas. As a result, it’s easy to lose focus and stray from the original research objectives you’ve laid out. By conducting a careful analysis of your interviews (and other qualitative data), you can maintain fidelity to your research goals.
→ Test your product management and data skills with this free Growth Skills Assessment Test.
→ Learn data-driven product management in Simulator by GoPractice.
→ Learn growth and realize the maximum potential of your product in Product Growth Simulator.
→ Learn to apply generative AI to create products and automate processes in Generative AI for Product Managers – Mini Simulator.
→ Learn AI/ML through practice by completing four projects around the most common AI problems in AI/ML Simulator for Product Managers.
Analyzing qualitative data by yourself
Below is a general process to follow when analyzing qualitative data:
- Step 1. Data Preparation: transcribe interview recordings.
- Step 2. Working with Data: structure transcripts, add tags.
- Step 3. Analysis: build a code tree / compile results.
- Step 4. Conclusion: formulate answers to research questions.
In the sections below, we’ll describe each step in detail. While this process is inspired by an academic approach to research, it’s worth acknowledging that professional researchers may simplify this process in practice.
Step 1 begins with transcription. After interviewing respondents, you’ll need to transcribe interview recordings in order to get raw data. In most cases, this requires converting video files into text files. Transcribing and saving interviews is useful for two main reasons.
- Firstly, if you’d like to locate a specific excerpt from a conversation, you can search your transcription file to find it. This way, you won’t need to spend extra time listening to the entire recording again.
- Secondly, creating a transcription habit can allow you to be more present during the interview process. When transcription is a key part of your research process, there’s no need to worry about taking notes during your conversation. This way, you can fully focus on the interviewee (and your research objectives).
The obtained data will form the basis for the final report
Experienced researchers experiment regularly with new tools in order to improve the quality of transcriptions or automate the transcription process. In our survey of researchers, Whisper, transkriptor.com, and sonix.ai were cited among the tools they use (see this guide for an overview of all tools).
After interview recordings are transcribed, they should be structured. Copying the structure of the questionnaire is the simplest way to do this.
Another option is to create codes (tags) that reflect the main ideas or themes present in an interview. This method allows researchers to organize their results, making it faster and easier to find important information after interviews have been conducted.
Tags can be applied:
- To data generated during a specific research project
- Across all projects, to link the results of various research projects together
To start, create tags (codes) that reflect general categories of conversation with interviewees. For example, a set of tags might include general questions, user experience, product design, competitors’ solutions, and more.
Tags can (and should) be customized to fit the needs of your research objectives. Creating tags that relate to your interview questionnaire and research topics will help ensure that the results of your research are organized and clear.
Above all, tags should be easy for you to work with. For more detailed instructions on how to create, maintain, and structure tag groups, refer to this guide.
Once you’ve created a group of tags, it’s important to maintain its structure for each interview. Tags can be especially useful if you plan to leverage interviews for additional persona work or other documentation.
Scholars who use a ‘grounded theory’ approach to research will mark different parts of a text (such as an interview) with codes. For grounded theorists, groups of interrelated tags are often referred to as a “code tree.” This approach can be studied in detail in Anselm Strauss and Juliet Corbin’s book, “Basics of Qualitative Research: Grounded Theory Procedures and Techniques.”
According to Strauss and Corbin, qualitative researchers can choose from three distinct coding methods: open, axial, and selective. The first option, open coding, does not involve applying predefined categories to text. Unlike open coding, an axial coding system establishes connections (e.g., causality) between categories or tags. The final system, selective coding, focuses on a central category around which a larger narrative or categorical system is constructed. Researchers who use selective coding methods can use tags to classify individual excerpts, and subsequently group these tags into broader categories.
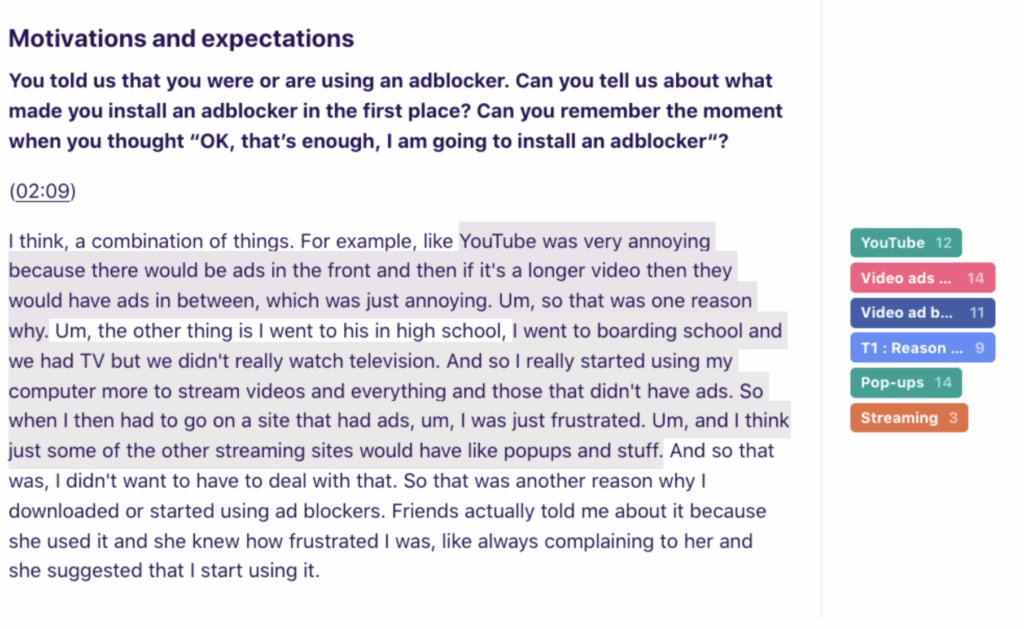
Depending on their goals, researchers can use different tools to analyze qualitative data and generate reports. When analyzing interview transcripts in depth, work can be carried out within a word processor like Microsoft Word or Google Docs. Researchers who use Google Docs to analyze transcripts can take advantage of the Highlight Tool plugin in order to tag specific sections with ease. This plugin saves time by automatically generating a summary table complete with codes, quotes, and comments.
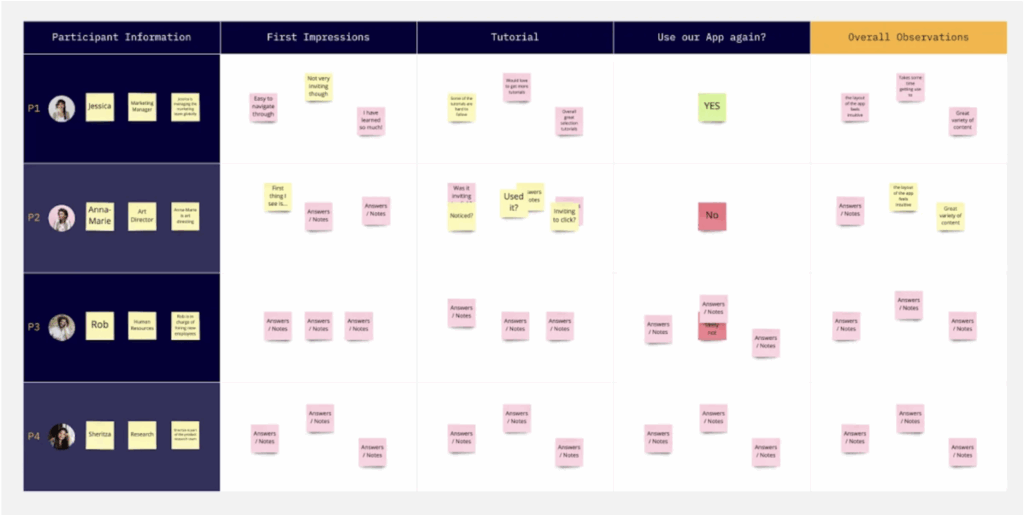
When compiling the results of usability tests for a designer, it’s often convenient to work in Miro, which makes it easy to add comments, recommendations, and quotes to a user interface (or “screen map”) . Similarly, Figma makes it easy to add comments to designs using stickers.
Useful tips
Feature quotes from interviewees whenever possible. When compiling a report on your research results, highlight specific quotes from respondents in order to support key conclusions or topic areas. These quotes will bring the user’s perspective to life, allowing the team to see things from their point of view.
Check qualitative data for trends and recurring patterns. Keep in mind that users might express the same problem in different words.
Separate the general from the specific. Remember, not every problem mentioned by a respondent is relevant to all users.
Compare and contrast data from different interview sections. To help identify trends and behavioral patterns, outline the similarities and differences in respondents’ answers to particular questions. For example, do users with similar financial means relate to your product in an analogous way? Are there dependencies present between their usage and their finances? Does the age or marital status of users affect the problems they are trying to solve with your product?
Remember the difference between facts and opinions. Users can be inconsistent, and their words may contradict their actions. For example, if a user encounters difficulties while performing a task, but describes the task as “simple”, pay extra attention.
Always keep research objectives in mind when interpreting results, drawing conclusions, and formulating recommendations based on your research. Whenever possible, separate primary problems from secondary problems. If a user mentions the criticality of a problem, give it special consideration. If users request small feature refinements or make comments that are tangentially related to your product, they may be secondary issues.
Record possible solutions when they come to mind. Sometimes, researchers may come up with ideas for new solutions (or new research projects) while collecting and analyzing data. When inspiration strikes, take notes so you can remember your ideas when generating recommendations or planning future research.
Typical issues
As researchers, we often witness the same mistakes being made when working with qualitative data.
Lack (or misunderstanding) of context
Responses to interview questions may be misinterpreted when researchers misunderstand the context in which they were provided. For example, let’s say a user mentioned not receiving push notifications from a mobile app. Due to this failure, this user missed an important event. After asking several clarifying questions, the primary researcher discovered that the user had push notifications turned off in their phone settings. Without this context, another team member might conclude that problems within the mobile app itself caused the user to miss their appointment. In this way, a lack of context can lead to inaccurate conclusions.
To prevent this, ensure that you have a comprehensive view of a user’s particular situation. If a user highlights a problem using your product, it’s important to understand not only the problem itself, but also the circumstances in which they encountered it.
For example, interacting with a navigation app is fundamentally different for users sitting in an office as opposed to those driving a car. When driving, notifications that might be convenient in other circumstances may actually interfere with making the right turns. Pop-ups that are helpful in one context may be harmful in another.
When drafting research questions, it’s impossible to account for all the possible answers (and situations) that a respondent might mention. As such, sometimes it’s necessary to deviate from your interview script and ask additional questions in order to understand a user’s context.
Ignoring contradictions
Always remember the goals of your research. If you don’t consider the variety of respondents’ opinions, you may come to general conclusions that don’t fully reflect all points of view. Sometimes a respondent may contradict themselves–in other cases, the views of different participants may diverge greatly. These difficult scenarios need to be considered when drawing conclusions.
Desire to quantify everything
Often, teams are overly focused on quantitative indicators (such as conversions and revenue), but forget that qualitative data can provide a deep understanding of the motives underlying the metrics. Qualitative research offers unique data that cannot be obtained from statistical analysis or other quantitative methods. The emotions, motivations, and preferences of users can help explain how users make decisions and why they use a product, which is incredibly valuable. That said, remember that qualitative methods do not guarantee (nor imply) a quantitative assessment.
By conducting a thorough analysis of interview data, you can identify patterns and better understand users’ needs and expectations. In particular, Interviews can be extremely useful for identifying causal factors. Qualitative data can help researchers understand the essence of a problem; not how often it occurs within a target group. For this reason, never present interview results as percentages, even though it’s tempting. Instead, use interview results to form a basis for structuring quantitative research projects in the future.
Conclusion
In-depth interviews are a useful tool for testing product hypotheses and developing an comprehensive understanding of users and their needs.
Analyzing the results of qualitative research allows researchers to reduce their subjectivity risk, highlight common issues and behavioral patterns, and identify important topics for further research or feature development.
The process of data analysis can be broken down into several stages: transcribing interview records, structuring data through tagging, identifying patterns, and formulating general conclusions.
When working with an array of collected data, check for recurring trends and patterns, and compare answers from different sections to find relationships and identify important user context.
Throughout this process, don’t forget about the original objectives you set out to achieve in your research. It’s important to distinguish information that will support hypothesis testing from unrelated user information and feedback. At the same time, it’s worth paying attention to instances where users speak freely about critical issues.
Illustration by Anna Golde for GoPractice