
We are increasingly hearing the claim that the era of mobile apps has come to an end.
Intense competition, substantial app store commissions, steadily rising user acquisition costs, and plateauing smartphone adoption rates support this view.
Yet, mobile apps remain a massive market with over $100 billion in annual revenue and plenty of success stories. Some apps still achieve remarkable results, reaching tens or even hundreds of millions of dollars in revenue within just a few months.
So which of these perspectives is closer to the truth?
To answer this question, we conducted a study and used data to answer the question:
💡 Is it really much harder to achieve success in the current market than it was, say, five years ago?
Table of contents
To see the study results, jump to the Key findings section. However, we recommend reviewing the methodology to better understand how to apply this data.
- Key findings
- Number of new apps in the App Store
- Changes in the share of “successful” mobile apps
- Reasons for changes in the share of “successful” apps
- Differences in the dynamics of “successful” apps in gaming vs. non-gaming segments
- Analysis by subcategory in the non-gaming segment
- Analysis by subcategory in the gaming segment
Methodology
How we evaluated the state of the mobile app market using data
To measure a new product’s likelihood of success in the mobile app market, we used data from AppMagic:
- We looked at all apps launched in the App Store from 2016 to 2023.
- For each app, we gathered revenue and download data from AppMagic.
- We calculated the percentage of apps launched each month that exceeded a cumulative revenue threshold of $100,000 from in-app purchases within the first year post-launch (reasons for this specific criterion are detailed below).
- We analyzed how this metric has changed over time, what factors influenced it, and in what ways.
AppMagic is an analytics platform used for market analysis and designing competitive strategies. It provides data on mobile app and game downloads, revenues, and popularity.
In AppMagic, revenue values are listed after deducting the App Store commission but before accounting for taxes.
Success criterion for apps: $100K cumulative in-app revenue in the first 12 months post-launch
We defined a mobile app’s “success” by the following criterion: cumulative in-app revenue exceeding $100,000 in the first 12 months after launch.
Why $100K revenue?
- It’s a significant and challenging target. Of all the apps published in the App Store since 2016, only 0.95% have earned more than $100K (regardless of the time taken to reach this milestone).
- In the gaming segment, the share of “successful” apps is higher (2.78%). In the non-gaming segment, the share of “successful” apps is lower (0.57%).
Why the 12-month window?
- We assess the likelihood of success for new apps (market conditions) at different periods.
- The 12-month benchmark allows us to compare apps from 2016 with those from the first half of 2023.
- For both groups, we use revenue data from the first 12 months post-launch to assess the difficulty of achieving target metrics.
How well does the criterion of achieving $100K cumulative revenue within 12 months reflect the probability of success for new apps and the state of the market?
- The $100K in 12 months metric strongly correlates with long-term app success. Apps that reach this target are highly likely to be “successful”, while those that miss it will likely fail.
- More broadly, the proportion of new apps that achieve this metric reflects the likelihood of success for a team launching a mobile app.
Methodology specifics
Before presenting our findings, we must acknowledge several methodological considerations that influence how this data should be interpreted.
The study relies on revenue and download estimates
AppMagic doesn’t possess actual download or revenue data for apps but estimates them based on app rankings in the in-store top charts.
According to AppMagic, estimates for most apps are within 10% of real values.
But it’s essential to keep in mind that these are still estimates and not official data.
It’s also important to note that AppMagic revenue data reflects earnings after App Store commissions but does not account for country-specific taxes.
The success criterion for apps is based on revenue, not profit
To evaluate the state of the market, we analyzed the “share of new apps that earned over $100K in revenue from in-app purchases in the first year after launch.”
It is worth noting that the revenue criterion is less reflective of market conditions than profit-based criteria.
The profitability rate of mobile apps has significantly declined over the years due to factors such as increased competition, rising user acquisition costs, growing team expenses, additional regulations, and more.
Inflation is not accounted for
Between 2016 and 2023, the U.S. dollar depreciated by about 30%.
For simplicity, we have excluded this variable from the study.
However, it’s worth noting that $100K in 2016 is equivalent to $130K in 2023.
Only App Store revenue is included
Mobile apps can generate income in various ways:
- Through in-app purchases or subscriptions
- Via advertising
- By selling physical goods
- Through payments on the web version of the product
- Other monetization methods
This study focuses on revenue data from in-app purchases and subscriptions processed through the App Store.
In this context, our definition of “successful” apps probably understates the true number of successful apps. Some apps generate revenue through advertising, commissions from product sales, and other avenues that we have not considered in this study.
We assume that the distribution of app revenue across different monetization methods remained relatively stable for most of the study period. Consequently, this aspect of the methodology should not significantly impact the core findings.
No data from Google Play in the study
It is impossible to obtain a similar dataset for analysis on Google Play due to insufficient data availability.
Growing popularity of web funnels and app monetization through web versions
In 2021–22, a widespread trend emerged where mobile app developers advertise the web version of their products.
In this model, users go through onboarding on the web version and subscribe to the premium version of the product before downloading the mobile app.
This approach helps developers address traffic attribution issues that arose after the changes in IDFA usage in iOS 14.5, as well as avoid App Store commissions. As a result, a substantial portion of revenue from such apps bypasses the store and is not visible in our study.
Web funnels are especially popular in Health & Fitness, Education, and several other categories. For a detailed analysis of web funnels, see our dedicated article here.
Key findings of the study
For clarity, we will refer to a “successful” app as one that achieved $100K in cumulative in-app revenue within the first 12 months after launch.
We intentionally put “successful” in quotes since this definition doesn’t cover all truly successful apps. As mentioned earlier, mobile products can generate income from advertising, commissions on physical goods sales, or achieve results over a period longer than 12 months.
- The probability of a new mobile app’s “success” peaked in 2018. At that time, 0.6–0.7% of all new apps uploaded to the App Store reached a cumulative revenue of $100K from in-app purchases within the first 12 months post-launch.
- Starting in 2019, the share of “successful” new apps began to decline. The decline accelerated in 2021 with the release of iOS 14.5, which introduced a new approach to IDFA usage. By 2022, the share of successful apps stabilized at around 0.4%.
- The true share of “successful” apps is likely higher than 0.4% due to the growing popularity of web funnels, which allow a significant portion of revenue to be generated off-store. However, it’s impossible to measure the magnitude of this factor’s impact.
- The decline affects both gaming and non-gaming apps, though it is less pronounced in the gaming segment. This difference is probably due to the higher turnover in the gaming segment (most games have a limited lifetime) and the limited applicability of web funnels in games.
- Key factors influencing the share of “successful” mobile apps include:
- ➕ Introduction of the subscription model and reduction of App Store commissions (late 2016).
- ➕ Gradual rollout of Apple Search Ads across countries (2016 to 2018).
- ➖ Saturation of the mobile market and increased competition (late 2018).
- ➖ Stricter subscription rules in iOS 13 (early 2019).
- ➕ Lowered commission for apps with revenue below $1 million (early 2021).
- ➖ New IDFA logic in iOS 14.5 (early 2021).
- ➕ Growth in the popularity of web funnels* (since 2021).
* While the influence of web funnels is positive, no aggregated revenue data from this channel exists, so it isn’t reflected in our data and figures.
App success in numbers
Number of new apps in the App Store
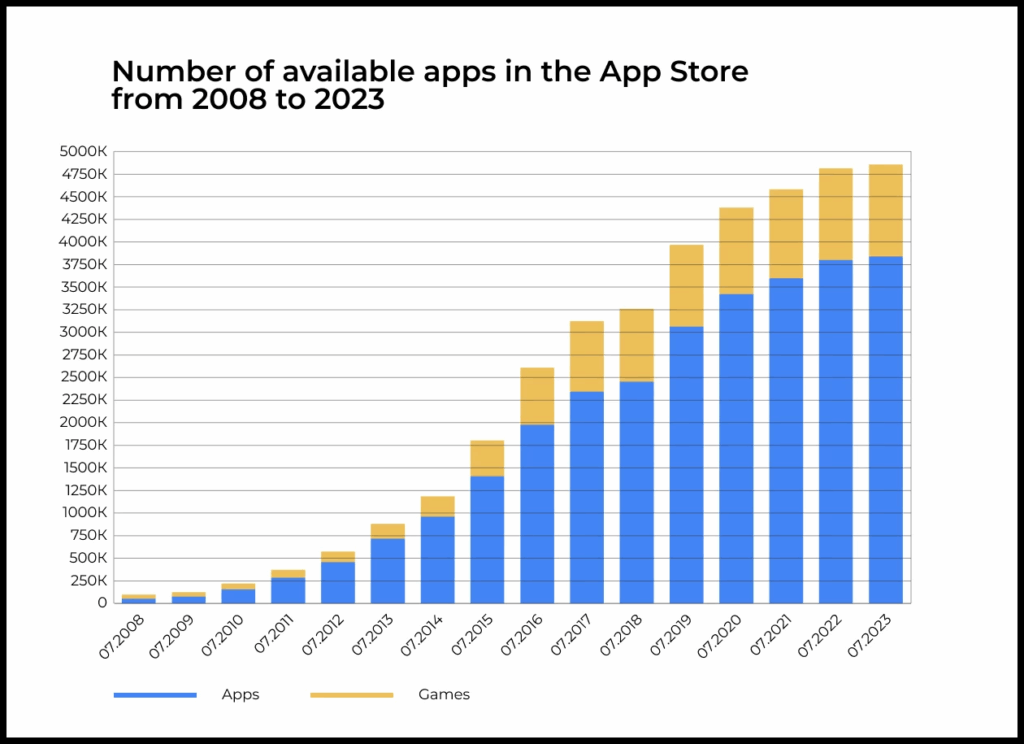
The number of new apps published on the App Store grew steadily from 2009 to 2017.
After peaking in 2017, the number of new apps declined slightly and stabilized at 30,000-40,000 monthly releases.
This translates to around 1,000 new apps published on the App Store daily for the past eight years.
Notably, fewer than 1% of these apps ever surpassed $100K in lifetime in-app revenue, regardless of time frame.
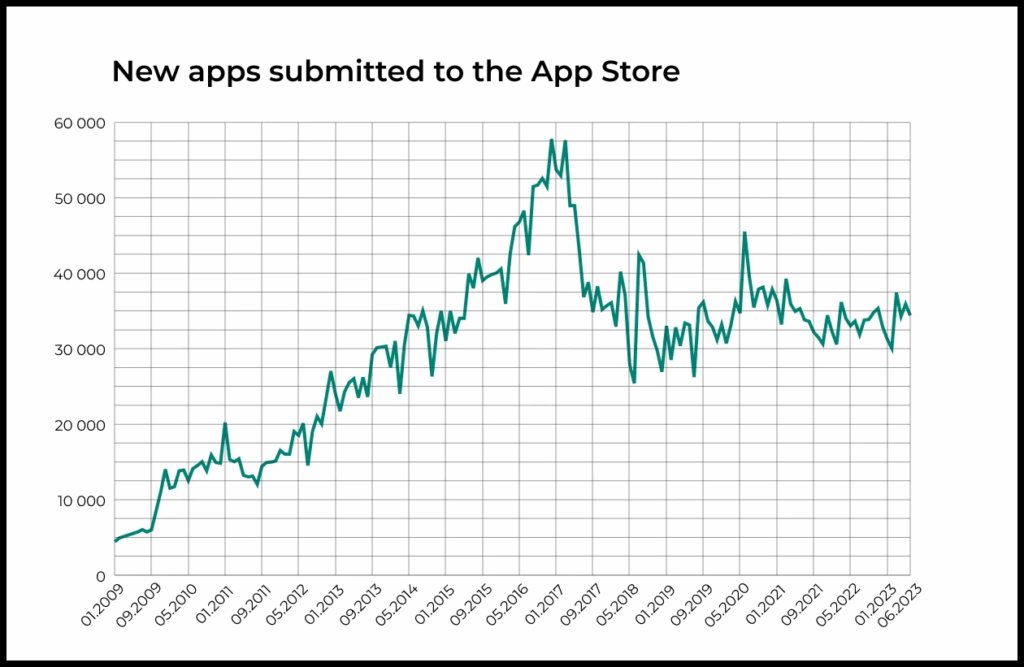
Data before 2016 is based on Pocketgamer.biz (via Statista). Data after 2016 is from AppMagic, cross-validated with public App Store data (Statista).
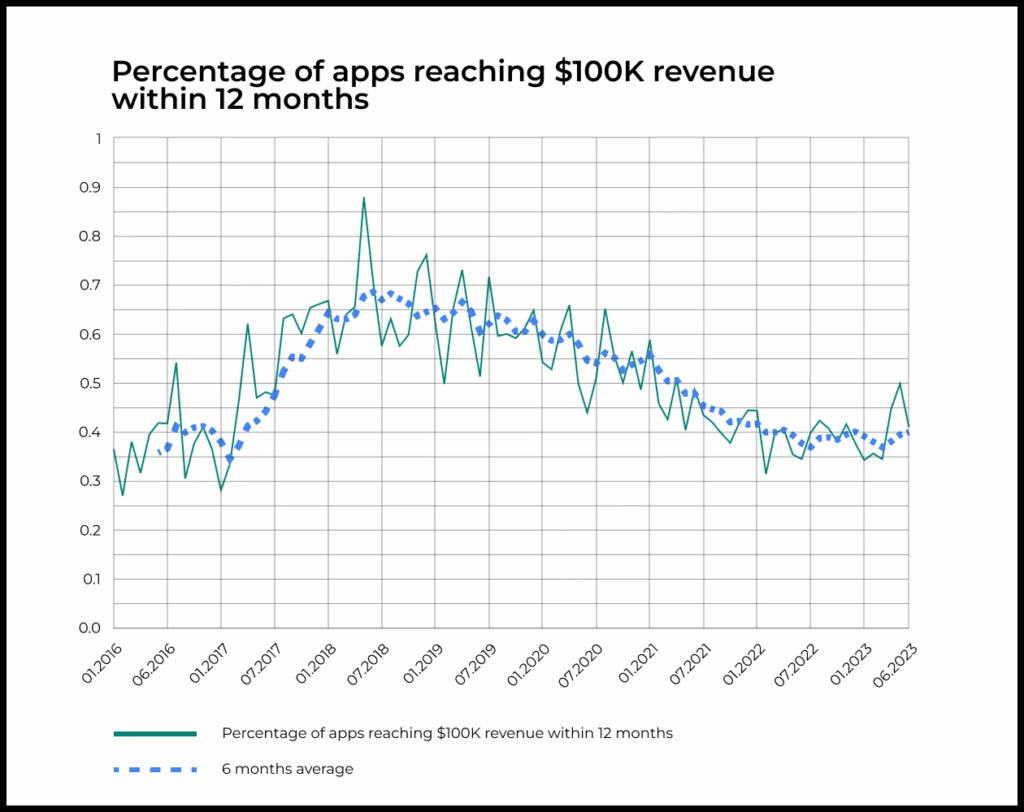
Changes in the share of “successful” mobile apps
Reminder: a “successful” app is one that achieved $100K in cumulative revenue within the first 12 months post-launch.
The share of “successful” apps peaked in 2018, with 0.6–0.7% of all new apps in the App Store reaching this threshold within the first 12 months of their release.
After 2018, the share of “successful” apps started to decline. Initially, this decline was gradual, but in early 2021, the downward trend accelerated sharply.
Eventually, the share of “successful” apps reached 0.4% and has stabilized at this level since 2022.
Reasons for changes in the share of “successful” apps
The following developments likely influenced the dynamics of app success:
• ➕ Rollout of the subscription model and reduction of App Store commission (late 2016).
• ➕ Gradual expansion of Apple Search Ads across countries (2016 to 2018).
• ➖ Mobile market saturation and increasing competition (late 2018).
• ➖ Stricter subscription rules in iOS 13 (early 2019).
• ➕ Reduced commission for apps with revenue under $1 million (early 2021).
• ➖ New IDFA functionality in iOS 14.5 (early 2021).
• ➕ Rising popularity of web funnels (since 2021).
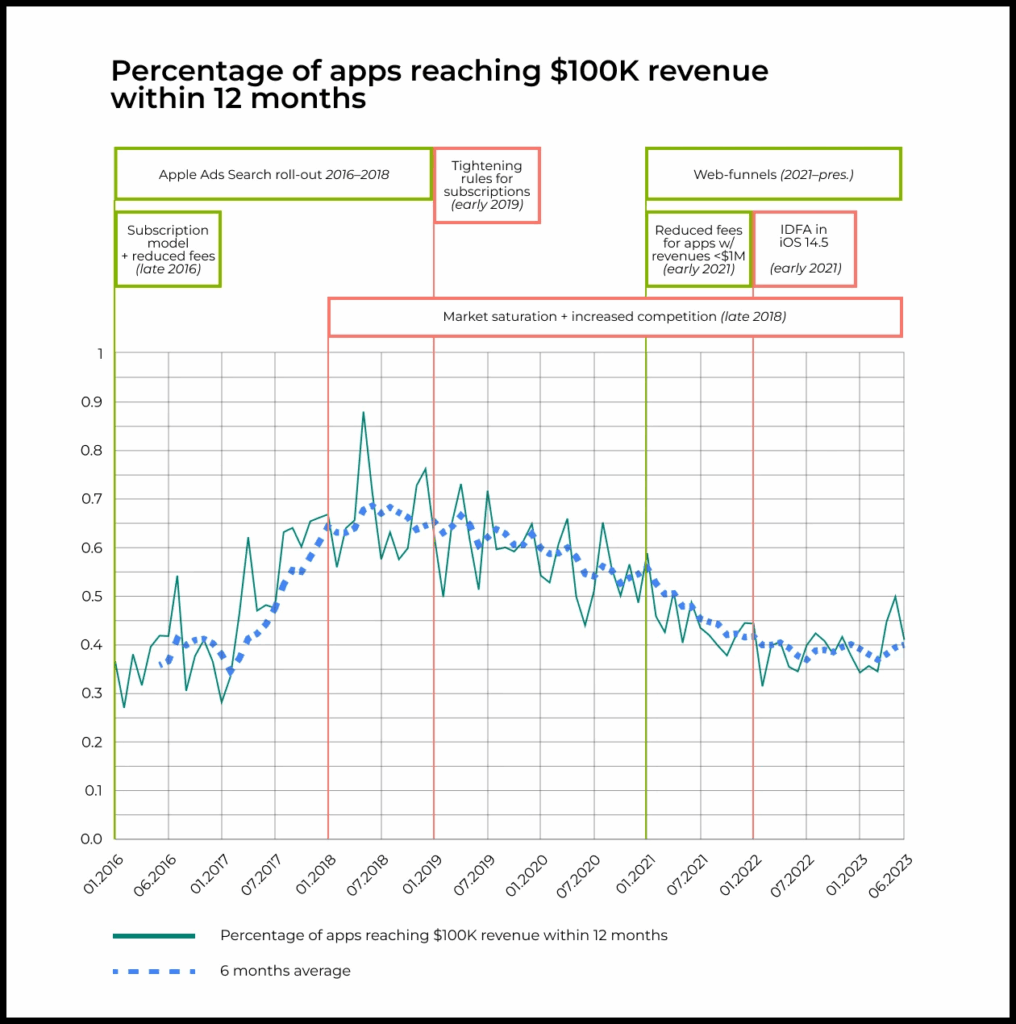
This retrospective analysis cannot confirm with certainty that these factors alone caused the observed changes in the share of “successful” apps. However, we have carefully examined major industry changes and events and can state with confidence that these factors played an important role.
Subscription model rollout (late 2016)
In September 2016, Apple changed its policies to allow all app categories to use subscriptions. Previously, subscriptions were only available for news apps and cloud services.
The subscription model quickly became popular across many categories. In several areas (such as Photo & Video, Productivity, and Health & Fitness), it radically transformed monetization effectiveness. In other categories, the impact was also substantial.
The enhanced monetization efficiency enabled publishers to attract users through paid growth channels, markedly improving their chances of success.
Reduction of App Store commission (late 2016)
Concurrent with rolling out the new subscription model, Apple changed the revenue-sharing model: developers’ share increased from 70% to 85% for subscriptions maintained beyond one year.
This further helped expand the adoption of the subscription monetization model in the App Store and became one of the drivers of growth in the share of “successful” apps from late 2016 to early 2018.
Gradual expansion of Apple Search Ads (2016 to 2018)
In 2016, Apple Search Ads became available in the U.S. It expanded to the U.K., Australia, and New Zealand in 2017, before rolling out across Europe and Asia in 2018.
While not a primary factor, the emergence of a new growth channel created momentum and opportunity for several new products.
Mobile market saturation and increased competition (late 2018)
- In the early 2010s, there were abundant opportunities and untapped niches in the mobile app market. By 2018, many of these were already filled.
- Similarly, the early 2010s saw explosive growth in smartphone adoption across developed regions. By 2018, this growth had significantly slowed.
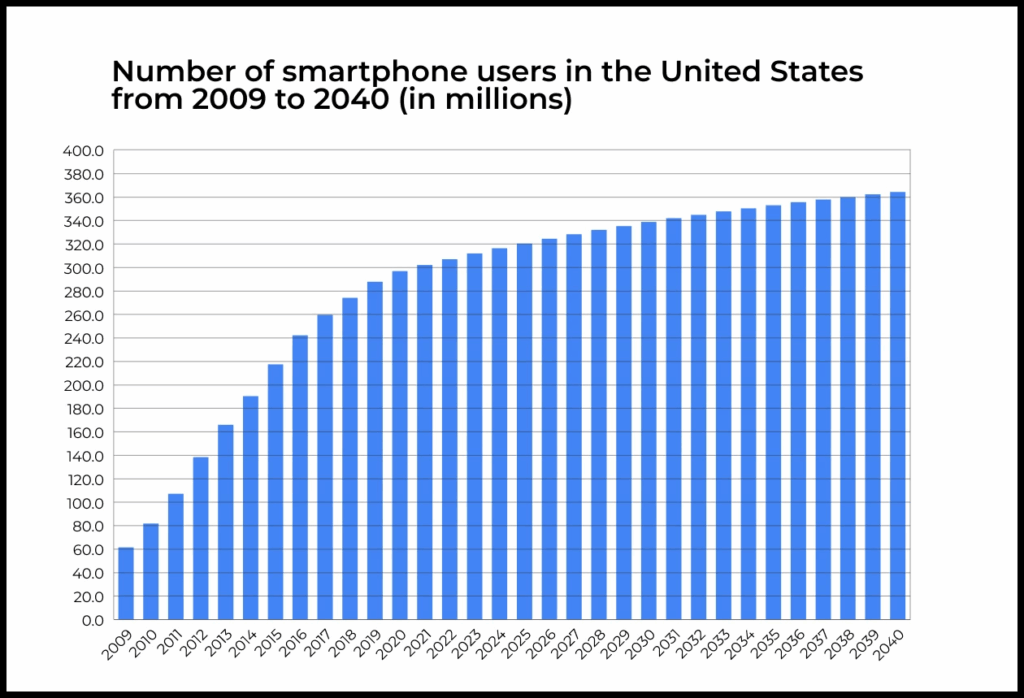
Similar trends, signaling mobile market saturation, are also seen in other indicators.
For example, 2018 marked a turning point in the growth of active apps in the App Store.
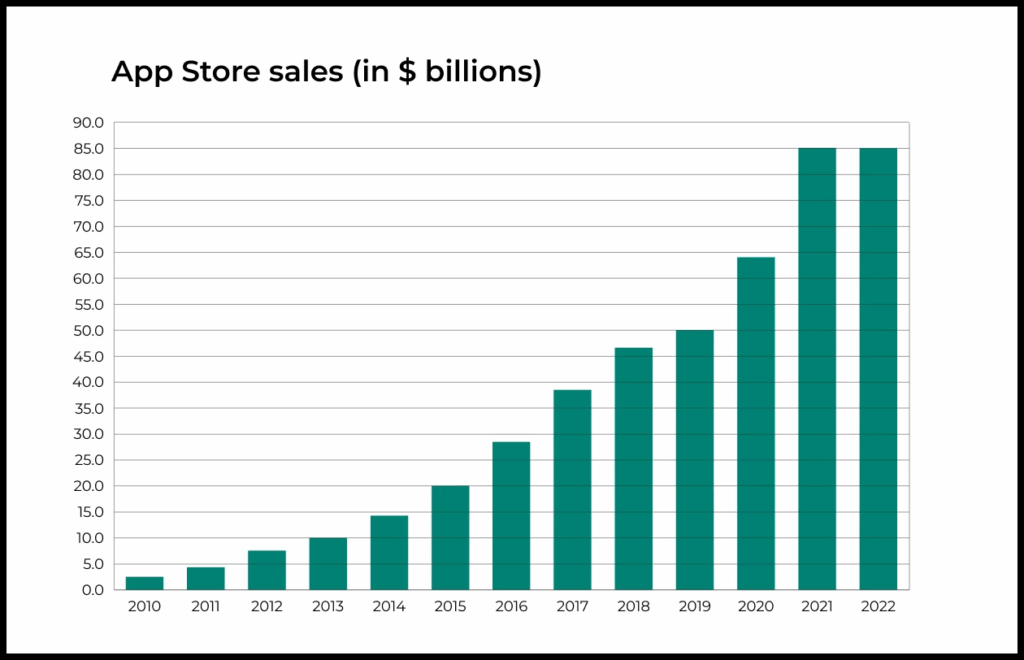
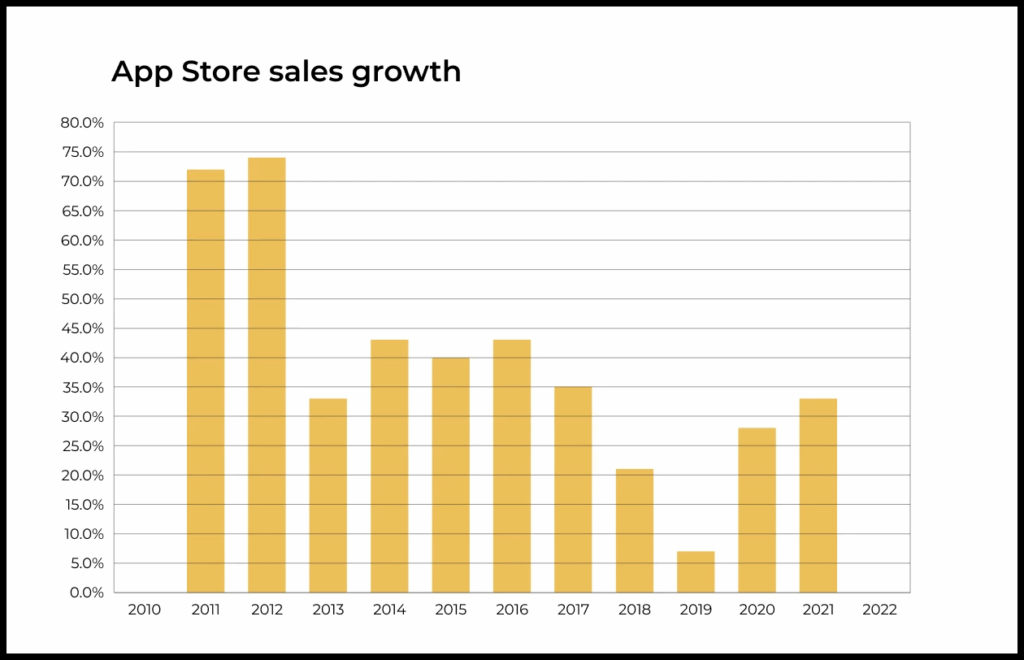
The same trend is visible in the App Store in-app purchase revenue.
Before 2018, App Store sales were at around 40% per year. In 2018, it dropped to 21%, and in 2019, to only 7%.
The COVID-19 pandemic temporarily disrupted this trend, driving growth back to 30% in 2020-2021 as digital adoption accelerated. After the pandemic, App Store year-over-year sales declined for the first time.
Why the pandemic is not listed as a factor affecting app success dynamics
We did not consider the pandemic as a separate factor affecting the success rate of new mobile apps. The key term here is new.
While the pandemic did lead to a sharp increase in mobile app sales, this growth primarily benefited established applications with proven business models. In contrast, new apps faced increased competition for users and their attention.
This pattern mirrors trends observed across other markets during the pandemic as well, such as the collaborative tools sector.
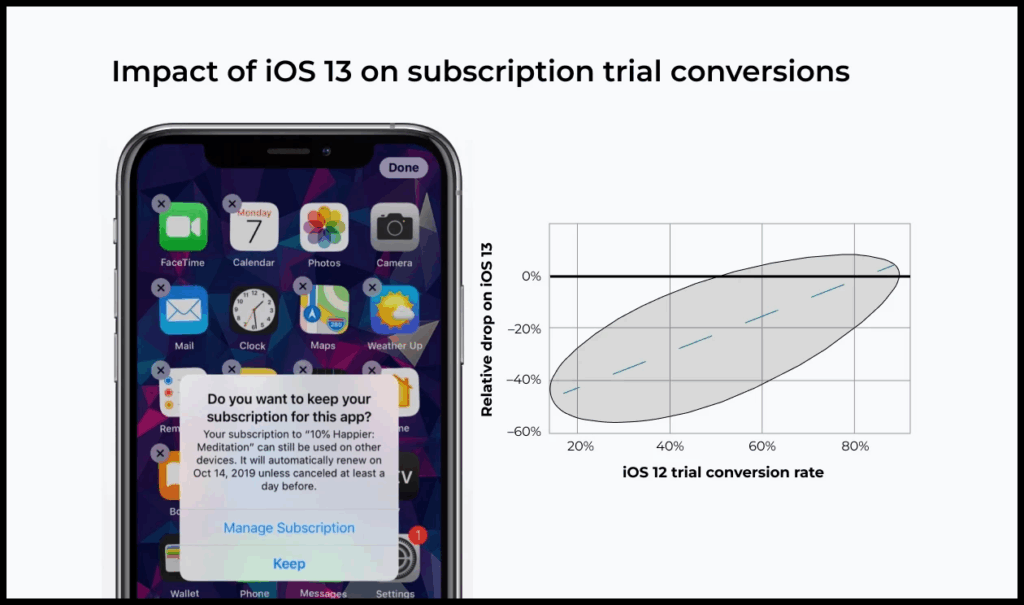
Stricter subscription rules in iOS 13 (early 2019)
With the release of iOS 13 in late 2019, Apple introduced stricter rules for subscription-based apps.
The update mandated greater transparency from developers, eliminated misleading subscription practices, and offered users the option to automatically cancel subscriptions upon app deletion.
According to RevenueCat, a service for managing and analyzing subscription-based apps, trial period conversion rates significantly decreased on iOS 13 for 80% of products in their sample.
On average, conversion rates dropped by 9 percentage points, with a median relative decrease of 29%.
Reduced commission for apps with revenue under $1 million (early 2021)
Starting January 1, 2021, Apple introduced the App Store Small Business Program.
Under the program, developers earning less than $1 million per year pay a 15% fee instead of the standard 30%. This change was aimed at supporting small and independent app developers.
New IDFA functionality in iOS 14.5 (early 2021)
The change in IDFA (Identifier for Advertisers) functionality in iOS 14.5 fundamentally changed the mobile market.
Apple made access to the IDFA opt-in, which means users had to explicitly consent to have their data tracked by developers. This drastically reduced the amount of data available for targeted advertising, making it harder to promote apps effectively. As a result, user acquisition costs increased and ad campaigns became less efficient.
In 2022, for the first time, App Store sales declined.
We’ve written about the IDFA changes and their consequences in our blog:
- iOS 14 & IDFA & attribution: a global change in the mobile advertising market
- Getting rid of IDFA, GAID and cookies. The imminent future of ad systems
- How Apple’s attack on Meta damaged everyone (except Meta)
Differences in the dynamics of “successful” apps in gaming vs. non-gaming segments
The share of “successful” apps in the gaming and non-gaming segments follows similar dynamics.
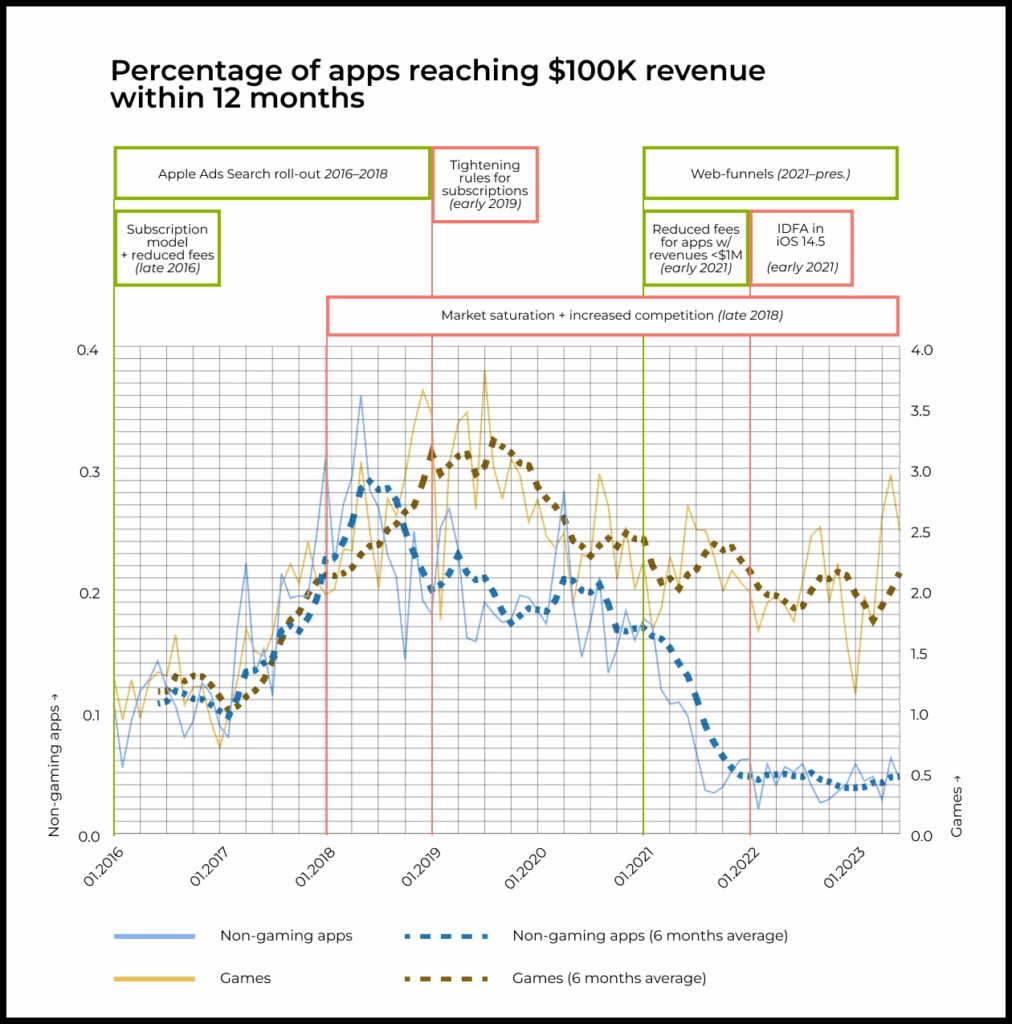
The key difference is in the impact of the IDFA functionality change.
Non-gaming apps experienced a sharp drop in the share of “successful” products. In the gaming segment, the decline is also present but less pronounced.
This may be due to several factors:
- The gaming segment is more dynamic. People don’t play a single game forever, which continually creates demand for new games. In non-gaming categories, market leaders often maintain their position for a long time.
- Games can’t use web funnels for user acquisition and all revenue goes through the App Store. Meanwhile, many non-gaming apps have shifted to web funnels, making their revenue invisible under the current methodology. As we noted earlier, the actual decline in the non-gaming segment is likely smaller.
- Another possible reason is that many non-gaming apps have a much narrower, more specific target audience than games. Consequently, the inability to optimize ad campaigns hit these products harder, especially new ones.
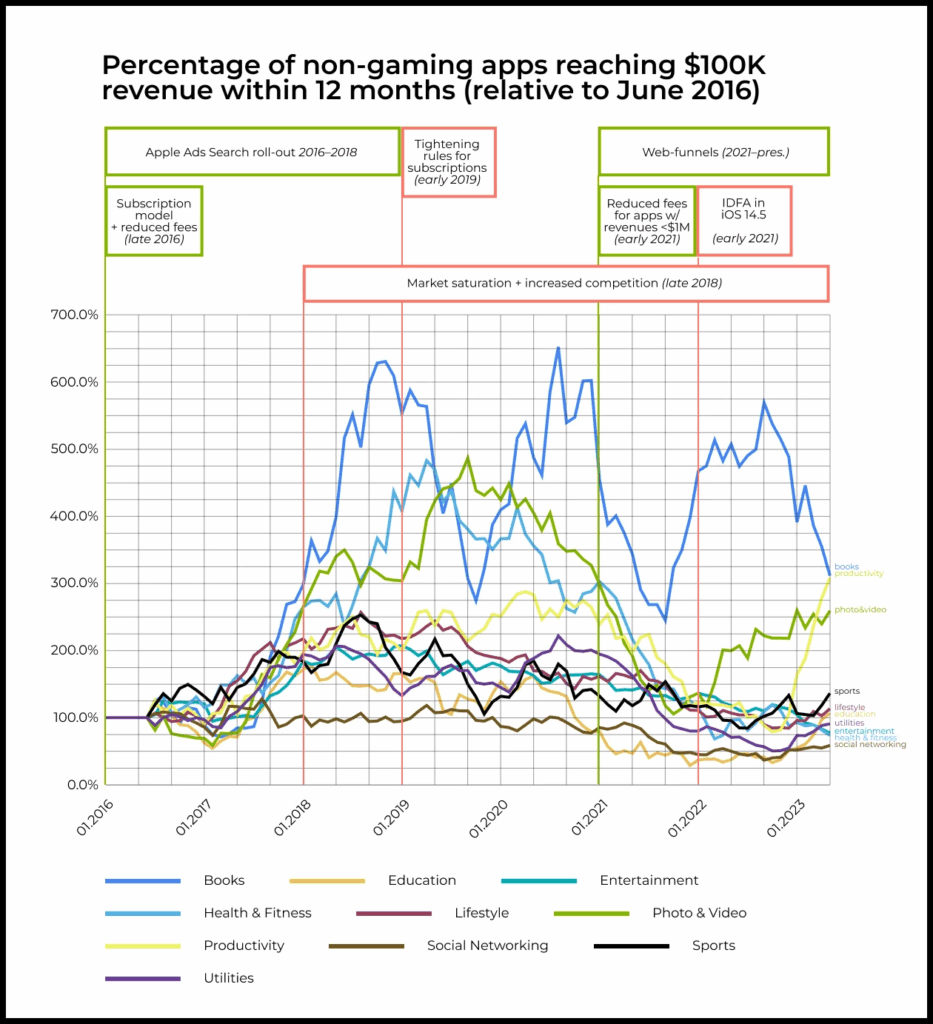
Analysis by subcategory in the non-gaming segment
For easier cross-category comparison, we normalized each category’s metrics based on the share of “successful” apps in June 2016.
We divided all data for each category by the share of “successful” apps in that category in June 2016. This way, the chart shows how the share of “successful” apps in each category changed over time relative to June 2016.
You can see the unnormalized chart showing the share of “successful” apps in each category, but it’s less convenient for comparative analysis.
Unnormalized chart
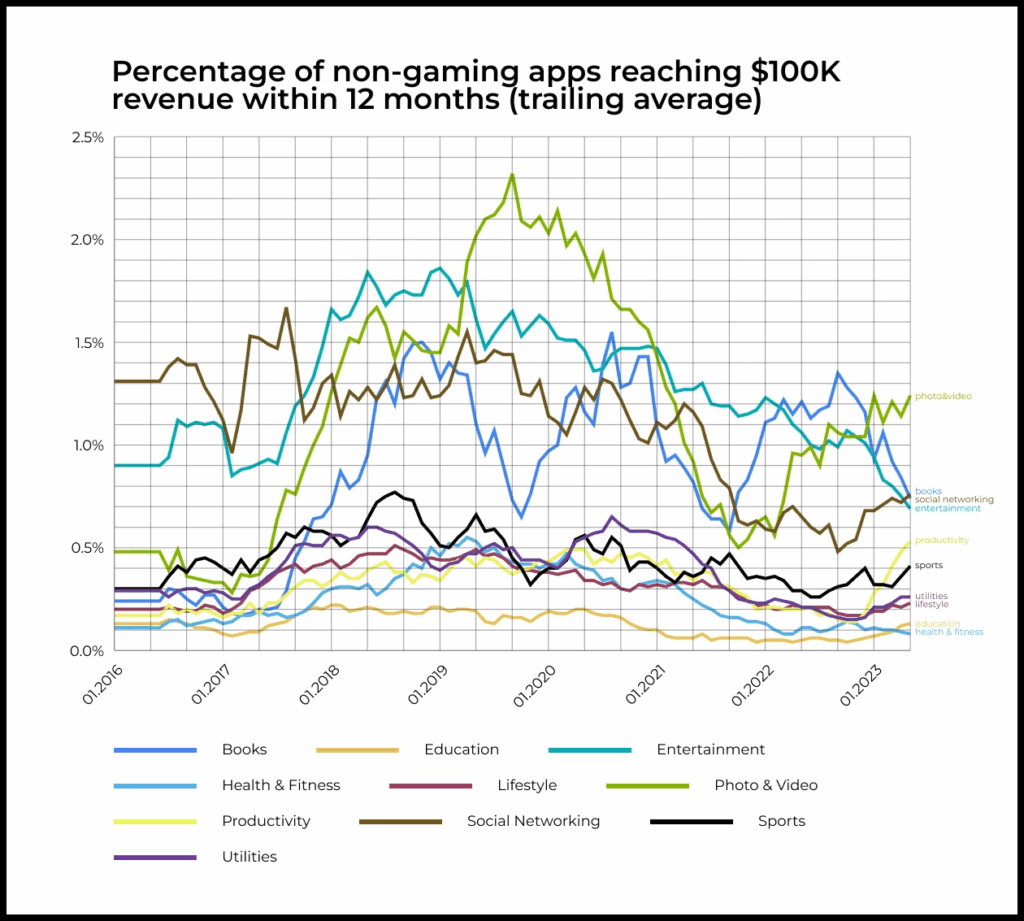
The effect of the subscription model rollout is particularly evident in the Books, Photo & Video, Health & Fitness, and Productivity categories.
Apps in these categories traditionally have low retention, which severely limits their monetization potential through one-time purchases. The introduction of subscriptions dramatically improved their monetization, unlocking paid growth channels.
Consequently, there was a sharp increase in these products and a simultaneous rise in the share of “successful” apps. Accordingly, we see a decline in success rates after Apple tightened subscription rules and likewise after new restrictions were imposed on IDFA.
In other categories, the effects are also noticeable but less pronounced.
The notable exception is the Social Networking category, which is primarily monetized through advertising and grows mainly through viral/organic channels, and was therefore less affected by the changes.
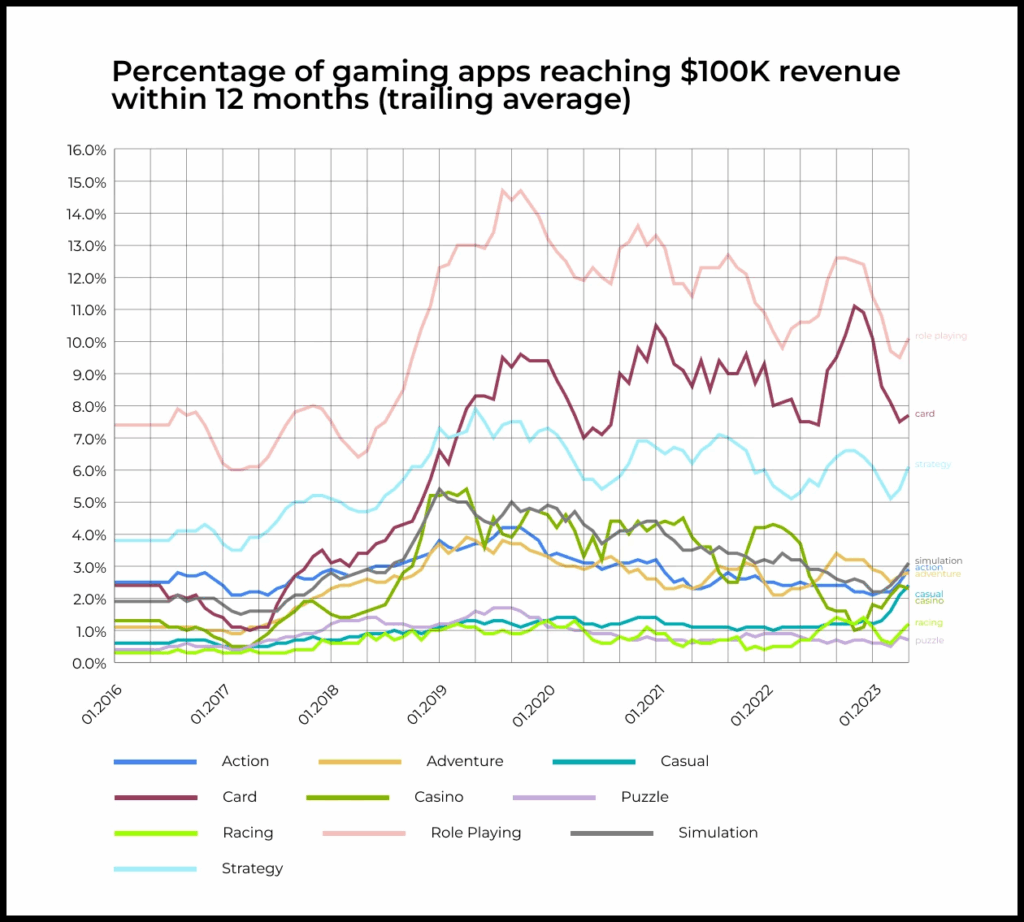
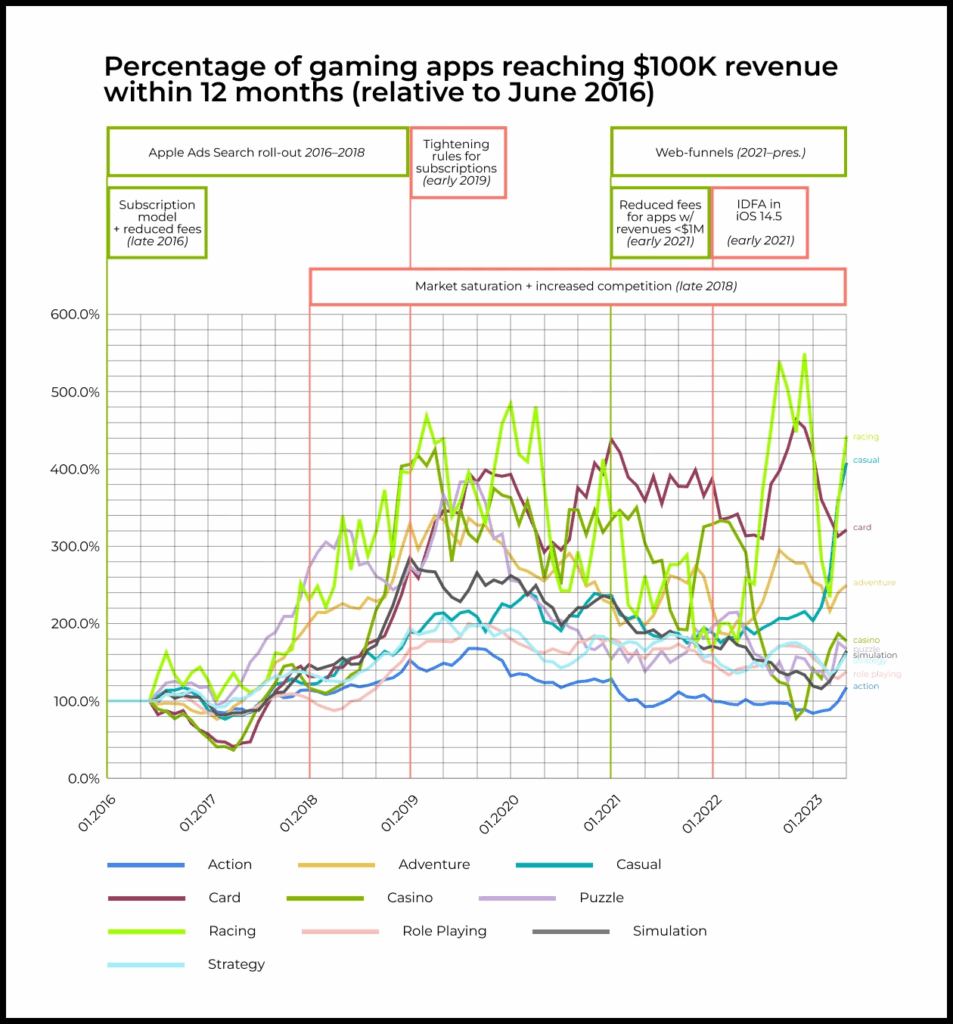
Analysis by subcategory in the gaming segment
Gaming subcategories demonstrate consistent “success” dynamics.
The factors discussed above, as well as the general maturation of players and devices over time, influence these dynamics.
Unnormalized chart
Conclusion
The best years for mobile app creation are indeed behind us.
The market has become far more saturated and competitive, though the probability of “success” hasn’t radically decreased.
Over the years, the smartphone has become the primary platform for most people. Therefore, any technological, social, or cultural breakthroughs and shifts will inevitably open new opportunities, including in the mobile app market.
Illustration by Anna Golde for GoPractice