
Forecasting the dynamics of revenue, audience, and other key metrics is an important process for any product that is in its growth phase. Having a good forecast helps to prioritize projects at the planning stage, and then helps to keep track of how quickly you are growing against the forecast, allowing you to spot problems as early as possible.
The very process of creating a forecasting model allows you to synchronize the team in terms of understanding the product’s growth model. It also provides a tool for assessing the impact of working on different areas of the model.
Today we will talk about building audience and revenue forecasts for your product using cohort analysis. We will also find out the pitfalls and difficulties of this process.
→ Test your product management and data skills with this free Growth Skills Assessment Test.
→ Learn data-driven product management in Simulator by GoPractice.
→ Learn growth and realize the maximum potential of your product in Product Growth Simulator.
→ Learn to apply generative AI to create products and automate processes in Generative AI for Product Managers – Mini Simulator.
→ Learn AI/ML through practice by completing four projects around the most common AI problems in AI/ML Simulator for Product Managers.
Cohort analysis is the basis for forecasting audience, revenue, and other business metrics for your app
Cohort analysis is the basis for predicting the dynamics of the key metrics of your business.
This metric divides users into cohorts based on the month they started using the product.
This means that if you build the forecast of a certain metric for a specific cohort of users (those who started using the product in month X) then you can easily project the forecast to the entire product. Thus, the forecast of the entire product can be simplified by scaling it down to a single cohort, which is easier to study. Since the process will be identical among cohorts, the results can then be scaled up to the entire product.
Forecasting the dynamics of the key metrics for a cohort of users is relatively easy because you can obtain it by analyzing historical data on older cohorts.
Now that we’ve discussed the basic idea behind building metric forecasts for a product, we can get into the different aspects of the process:
- Understanding the relation between the metrics (audience numbers, retention, revenue, etc.) of individual cohorts and the entire product
- Predicting the dynamics of revenue, audience and other metrics for a specific cohort of users
- Predicting the size of the cohorts that will come to the product in the future
- Using Google Sheet templates to predict revenue, audience numbers, and other metrics
- Understanding the nuances, pitfalls and difficulties within the process of building the forecast.
Understanding the relation between the metrics (audience numbers, retention, revenue, etc.) of individual cohorts and the entire product
Consider the following product, let’s call it X.
First month after launch
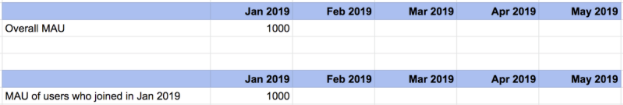
You launch product X in January 2019. In January (the first month after the launch), 1,000 new users come to the product, and they spend $100.
In January, the app’s MAU will be 1,000 users, and the revenue will be $100, since at the moment, the product is entirely represented by one cohort of users who came in January.
Second month after launch
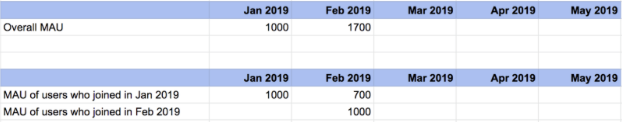
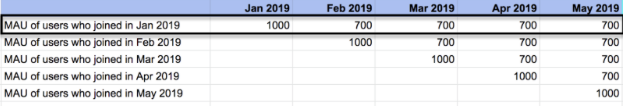
In February 2019, another thousand new users join the product. They spend another $100. At the same time, 700 of the users who came in January are retained in February. These users spend $70.
Thus, in February (the second month after the launch), the product’s MAU will be composed of the February cohort of active users (1,000 people) and what remains of the January cohort (700 retained users). That is, the audience will equal 1,000 + 700 = 1,700 users.
Revenue in the second month will be equal to $100 + $70 = $170. It will also encompass the revenue of the two currently available cohorts of users.
Third month after launch
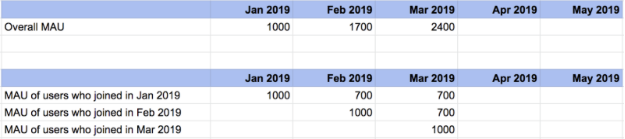
As in previous months, in March, we will add a third cohort of users (people who started using the product in March).The overall metrics will be the sum of metrics for the January, February and March cohorts at the end of March.
* Do not be surprised that the retention rate of the product is so high (i.e., reaches a plateau at 70%) – this is an imaginary example meant to illustrate the calculation method.
Month-N after launch
When we reach the end of month N after the launch, we will have N cohorts of users based on the month the users started using the product. The MAU for the entire product for month N will be equal to the sum of the audiences of each of the available cohorts in month N.
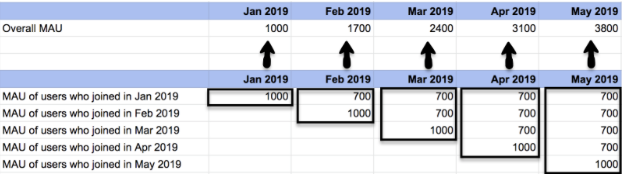
If you use a bar chart to visualize the process described above, then your product’s MAU will look like this:
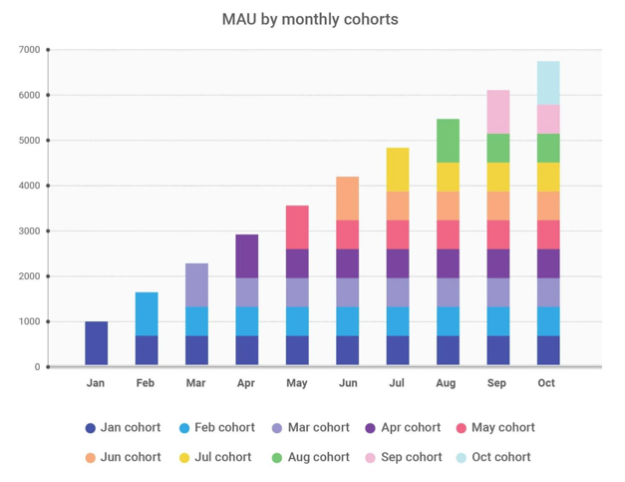
Each color in the chart represents a cohort of users who came in a particular month. The overall audience of a product in a given month consists of the audience of all of the available cohorts of users.
Why did we present the audience and revenue for each month as the sum of these metrics for individual cohorts?
The goal of this exercise was to show that the key metrics of your product in any month are directly determined by their corresponding values in the cohorts of users, created based on the date the users joined the product.
This means that if we can predict the metric for all cohorts of users for a specific month, then we can easily get a forecast of this metric for the entire product (by summing the values from all cohorts).
Predicting the dynamics of revenue, audience numbers and other metrics for a specific cohort of users
Predicting the dynamics of revenue, audience, or any other metric for a particular cohort of users is relatively simple. To do this, you need to use the cohort’s historical data.
Usually, you need to take the oldest relevant product cohorts in order to get their actual dynamics, and then project this dynamics to the new cohorts.
For example, to predict a monthly active audience (MAU), you can take the following steps:
- Take an old relevant cohort of users and calculate the MAU for this cohort by month. By “relevant” I mean that the cohort must reflect the current state of the product. In this context, a cohort that has existed before a major change to the product does not qualify as relevant.
- Divide the resulting set of values by the size of the cohort (the number of users in the cohort). At this step you will obtain the monthly retention rate.
- Using monthly retention, you can easily predict what will be the audience of a particular cohort of users for any month. To do this, multiply the size of the cohort by the retention rate of the corresponding month.
- If you need to get the dynamics of the predicted metric for months that go beyond what you can get on the basis of the oldest relevant cohorts, you will need to make an assumption about the metric’s future dynamics:
- For example, if the cohort’s audience has been steadily decreasing by 3% every month starting from some point in time, then you can assume that the same trend will continue in the upcoming months.
- If the metric seems stable, you can assume that it won’t change in the coming months.
- There is no universal approach to this task. You will need to decide on a case-by-case basis.
Let’s look at how this will work in the example of the app X that we examined earlier in this essay.
1. We take those who came in January 2019 as an old relevant cohort of users.
2. Based on this cohort, we calculate the monthly retention rate of our product. To do this, we need to divide the audience number by the size of the cohort (1,000 users).
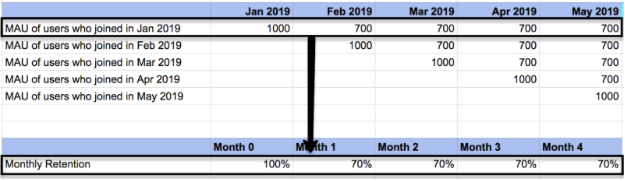
3. Now we can make the MAU forecast of other cohorts for the month we are interested in. For example, the Month 4 MAU of the cohort that came in May 2019 will be equal to the number of users in this cohort multiplied by 4th month retention (1,000 * 70% = 700).
4. If we want to predict what the cohort’s MAU will be on Month 7, then we will need to assume what will happen with the monthly retention rate.
In our case, the task is simple: retention has remained steady since Month 1, so we can assume that it will remain the same in the following months. As we collect more data in the future, we can modify the forecast if we observe any changes to the retention rate.

The same procedure will help you to predict any other growth metric. Let’s see how this works on the product’s revenue forecast:
- Take an old relevant cohort of users and calculate its month-by-month revenue.
- Divide the resulting set of values by the size of the cohort (the number of users in the cohort). At this point, you will receive an approximate revenue retention rate for a cohort of users.
- Using the metric above, you can easily predict what the revenue of a particular cohort of users will be for any month. To do this, you need to multiply the cohort size by the value of the metric calculated in the previous step for the corresponding month.
- If you need to obtain the dynamics of the predicted metric for months that go beyond what you can get on the basis of the oldest relevant cohorts, you will need to make an assumption about the future dynamics of the metric.
Forecasting metrics for a cohort of users is simple: first we get the data on how this metric changes for some old relevant cohort, and then we assume that other cohorts will have similar dynamics.
Predicting the size of the future product’s cohorts
The last missing piece for creating a revenue or audience forecast is information about the size of future cohorts of users who will come to your product. That is, creating a forecast for the number of new users.
There is no universal way to predict the future number of new users, since the growth models of different products are fundamentally different.
To solve this problem, you will need to build a forecast of the number of new users for each of the distribution channels, based on the available levers and the limitations each of them has.
Using Excel / Google Spreadsheet template to project audience numbers, revenue and other product metrics
At this point, we’ve have already discussed:
- How to forecast the number of new users in the future (i.e., estimated size of the future cohorts).
- How to forecast active users, revenue or other metrics for a specific cohort of users.
- How the metrics of user cohorts, selected based on the date users joined the product, make up the metrics of the entire product.
If you understand the logic behind all the above steps, then creating a forecast becomes a solely technical task.
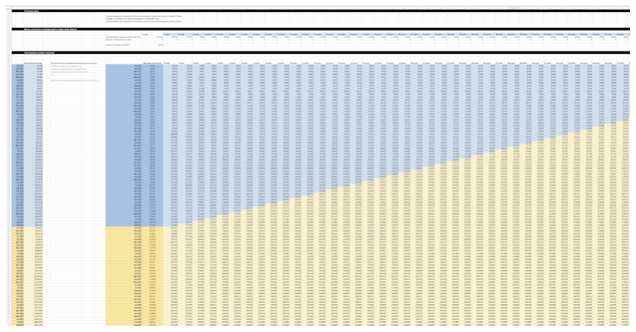
You can find an example template for forecasting product revenue here [file].
In this file, we forecast revenue for a product that was launched in January 2015. The forecast was made in October 2019. All the actual data in the file is highlighted in blue, and all of the forecast data is highlighted in yellow.
Creating a forecast works as follows:
- We calculated the month-by-month revenue of the users of the oldest cohort (see row 11 in the file).
- We divided the result from the previous step by the number of users in the cohort (see row 12 in the file).
- We made a forecast of the number of new users from October 2019 to the last month that we want to have the forecast for.
- Based on the value obtained in step 2, we built a revenue forecast for all product cohorts, created based on the month users started using the product.
- The only thing left is to add the values of the cohorts in the right way to get the revenue of the whole product in future months.
Read all about how this forecasting approach is applied in practice in a previous essay where I talked about the future of Calm and other subscription-based apps after the changes made in iOS 13.
Improving revenue and audience forecasting models for the app
Make separate forecasts for the key audience segments
One way to improve the quality of forecasts is to calculate individual forecasts for the key segments of the audience.
For example, you can make separate forecasts for different distribution channels or for different markets where your business is represented.
The allocation of individual segments makes sense when the dynamics of the predicted metric in these segments is significantly different, or when the segments are governed by different laws (different levels of competition, different growth drivers). If you do not make forecasts for individual segments, then you may face a problem when the dynamics of the cohort’s metric will strongly depend on the distribution of users by the segments, which can change over time.
Make sure to consider the future impact of product and marketing changes on the model’s key metrics
If you’re making a forecast for a year or a longer period of time, then it makes sense to consider how the team’s work will affect retention, monetization, and acquisition of new users over the year. Reflecting potential future changes in the model will depend on the kind of changes and the effects you expect from them.
Some companies make forecasts for the basic scenario where they assume there will be no significant changes to the core product metrics. This forecast is considered as the minimum expected level of product growth.
Add seasonality to the forecast model
When calculating the dynamics of the metric based on the historical data, the seasonal effects are likely to smooth out or disappear. Seasonality has a strong impact in many industries, so it is important to make sure to correctly reflect this in your forecast.
Seasonality can be addressed in one of two ways: Either you can add it at the coefficient level for the total value of the metric for the entire business (coefficients for specific months of the year), or you can factor it in at the level of dynamics of the specific cohorts.
The second option gives a more accurate result, but it is more expensive to implement. The first option is simpler, but in some cases it may poorly reflect the influence of seasonality (especially if the product is going through rapid growth).
Complete the forecast with other metrics that characterize your business
Often, after building a revenue and audience forecast and other key high-level metrics of your business, you can easily build an expected future P&L or any other kind of reports.
For example, this way you can evaluate the future cash flows of your company, and understand how much money you can invest in new experimental products/projects next year.
Pitfalls to avoid when forecasting revenue and audience numbers
Prediction issues for apps with strong long-term retention
If you are working on an app with a stable long-term retention, and you are using a device_id (device characteristic) as a unique user identifier in the analytics system, then you will encounter a rather unusual problem.
People change phones every year or every year and a half. If you consider a specific user who did this, then at the time of changing his device the following will happen:
- Activity from the original device_id will disappear, which will be reflected in the data as a decrease in the retention rate.
- If the user installs the product on a new device, a new user will appear in the analytics system with a new device_id, which will be reflected in the data as the growth of the new users.
- The problem occurs because this supposed “new user” will behave differently than usual new users.
This may seem like a minor problem at first glance, but it will have a strong impact on forecasts for products that have solid long-term retention rates. Forecasts hinge on being able to create accurate user cohorts. Without being able to place users in their respective cohorts, the forecasts made on their behavior will become inaccurate over time.
You can solve this problem by asking users to create an account in your product, so you will be able to identify them when they log in from a new device. You can also use more sophisticated ways to identify users based on their addresses or other data.
Some services make use of an unusual approach and form cohorts based on the moment users make their first purchase. Thus they make forecasts only with the customers and not any user. Everything that happens before the user’s first purchase in this case can be considered as part of a marketing funnel.
Slack uses this approach. This became clear when they published their data before going public. You can read more about Slack and their business model here, here and here.
Your forecast ignores what is not included in the historical data
We used historical data to make forecasts. Therefore, in fact, we got a forecast of what will happen if everything stays the same as it was before.
As we found out during the COVID-19 pandemic, life and the world around us can change quite rapidly, and we cannot take such effects into account in advance. But at the same time, such a forecasting model gives you all the tools to conduct various kinds of stress tests on your product and evaluate their impact on high-level and business metrics.
For example, you can consider a scenario where the influx of the new users will be five times greater in order to assess the impact on the number of active users and understand how many servers you will need to support your product.
You must have a deep understanding of the product’s growth model to build a high-quality accurate forecast
The described approach to forecasting is quite universal. It works for any metrics and for almost any kind of products and businesses. The quality of the forecast mainly depends on how well you understand your product, its growth model and the internal dynamics of the distribution channels and the market.
It is also crucial to understand that forecasting is a tool for exploring your product, finding the levers to drive key metrics, and conduct stress tests. A good model will allow you to evaluate the impact of various potential projects and development vectors on the topline metrics of your business.