Cohort analysis is a highly effective product and marketing analytics tool. Unfortunately, few people know about it, and those who do rarely use it.
This essay will discuss the following:
- What is the essence of cohort analysis?
- What is the difference between growth metrics and product metrics?
- Why do attempts to build product analytics based on growth metrics fail?
- How to use cohort analysis in marketing and product analytics
- Which product metrics should you monitor and why?
→ Test your product management and data skills with this free Growth Skills Assessment Test.
→ Learn data-driven product management in Simulator by GoPractice.
→ Learn growth and realize the maximum potential of your product in Product Growth Simulator.
→ Learn to apply generative AI to create products and automate processes in Generative AI for Product Managers – Mini Simulator.
→ Learn AI/ML through practice by completing four projects around the most common AI problems in AI/ML Simulator for Product Managers.
Cohort analysis in marketing and product analytics
Let’s try to compare two cars and find out which one is better.
The first car:
- Traveled 2,000 kilometers
- Is used five times per week
- Drove an average 10 kilometers on each trip last month
- Is driving at 100 km/h at this moment
The second car:
- Traveled 12,000 kilometers
- Is used four times per week
- Drove an average 20 kilometers on each trip last month
- Is driving at 70 km/h at this moment
The reality is that it’s impossible to answer this question based on the information we have.
But when it comes to web and mobile apps, product teams monitor metrics like DAU, MAU, income, total number of registrations, and use them to draw conclusions about the product, the impact of changes, and the effectiveness of marketing activities.
The above metrics are growth metrics. They are useful to get a general understanding of the situation. But when working on a product, these metrics are useless and they can’t help in making product decisions or assessing the impact of product changes.
When you work on a product, you should be primarily interested in its “volume” and “density,” not its “mass”. “Mass” simply states a fact, without explaining where it came from and how to influence it. You should strive to decompose key metrics into their components and determine their leverage. The main task when working on a product is to identify leverages and find ways to influence them.
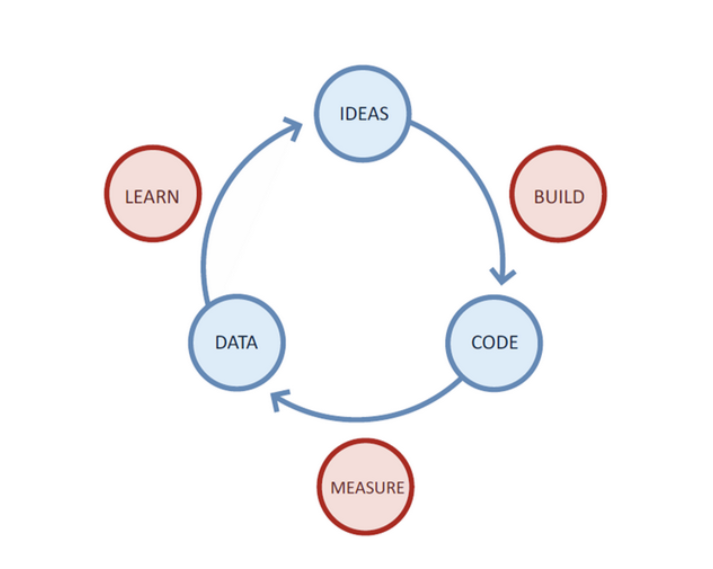
For this, you need analytics. Analytics tools are your eyes in the product world and provide feedback on your actions. First, analytics allow you to understand where you are, what kind of product you made, and how it is used in the real world. They also enable you to see how your actions—the changes you make to the product—affect your product. Working with analytics is summarized in the three stages pictured below: build, measure, learn.
In this essay, I will be talking about cohort analysis, one of the most effective product analytics tools.
Why growth metrics are useless for product analytics
Let’s consider a hypothetical situation in which a product has the following characteristics:
- User acquisition cost is $1
- Average income per user is $2 over the next four months
- 30% of new users continue to use the product after one month, and then they gradually decrease to 15%
- The promotion team will attract 10,000 new users in the first month after launch, 15,000 in the second, 20,000 in the third, and so on.
- The product manager, who is responsible for product development, makes changes to it every month. The changes turn out to be unsuccessful, so after each update, revenue per user drops by $0.1, and the share of users who continue to use the product falls by 2%.
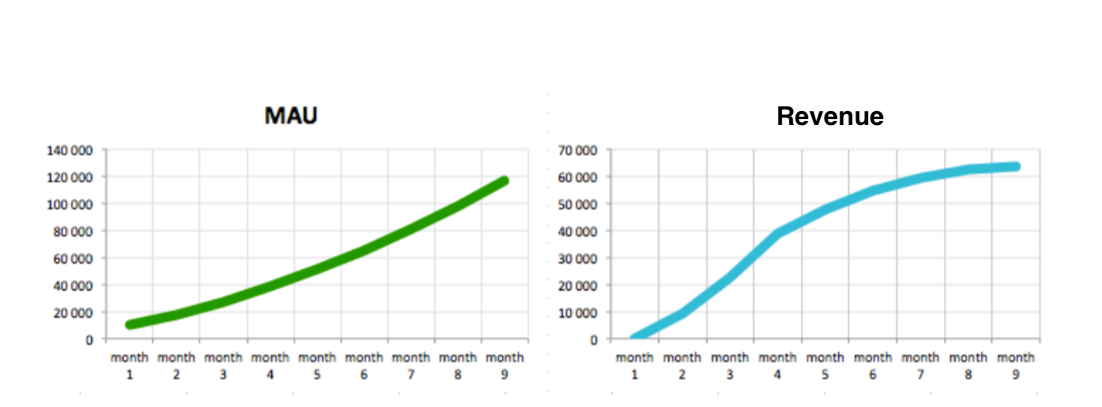
The company that develops this product keeps track of the monthly audience (MAU or Monthly Active Users) and the profit of each of its products. The team sets its KPIs and evaluates its success based on these metrics.
By following these metrics, after the first nine months, the management was very pleased with the results of the new product and the success of the product manager.
But while the MAU, a growth metric, is improving, the product is actually getting worse every month.
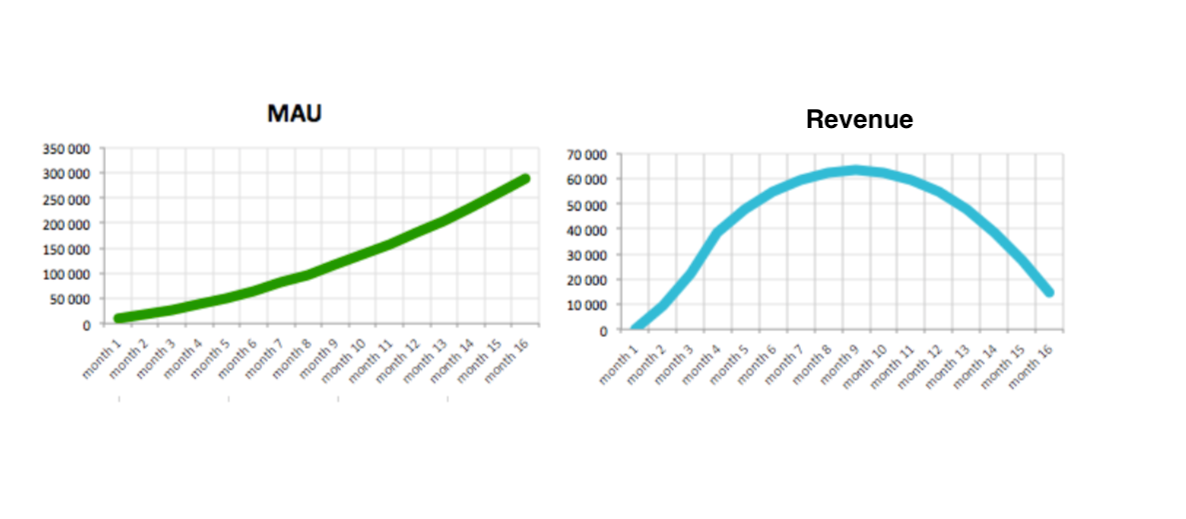
Below are the same charts, but for 16 months. In these graphs, we are finally seeing the first signs of unsuccessful product changes. But it took 12 months for the product’s negative trend to become obvious.
Growth metrics are influenced by two components: product and promotion. By keeping track of growth metrics, you cannot simply separate these two factors. This is why growth metrics are inappropriate for product analytics (the main goal of product analytics is to give you a clear answer of the impact of the change you made on user’s behaviour).
If the team used the right metrics, they would have spotted the negative impact of their product updates in the first weeks or months.
The essence of cohort analysis
On any given day, your product audience is a combination of users who started using your service today, yesterday, a month ago, and so on. Keeping track of this heterogeneous mass and trying to draw conclusions is extremely difficult.
Cohort analysis divides users into groups according to certain characteristics and tracks their behavior over time. This allows you to see the journey of each group of users throughout their lifecycle in your product.
In this method, users are usually grouped based on the week or month they joined the app. Each of these groups—called “cohorts”—is tracked over time and their key metrics are measured and recorded. Therefore, if you compare, say, the key metrics of the March and May user cohorts, you’ll be able to objectively compare the different versions of the product that were released in each of these months.
For deeper analysis, the selected cohorts can be further segmented based on traffic source, platform, country, and other factors that are relevant to your specific product.
The values of your key metrics will probably differ for different segments, just as each product change will affect different user segments in different ways.
Key product metrics – LTV and CAC
Two key metrics that ultimately determine the financial success of your product are LTV (Lifetime Value) and CAC (Customer Acquisition Cost).
LTV is the contribution margin you get from the average user in your mobile app over the entire period she uses it. CAC is the average amount of money you spend to acquire each user (through marketing channels, ads, etc.).
You can read why these two metrics are so important for your product and how they affect your business performance in the articles “SaaS Analytics. Viability Criteria” and “Startup Killer: The Cost of Acquiring Customers,” or watch it here.
In this essay, I will assume that you already know the importance of these metrics and will focus on explaining how you can work with them.
I will also not dwell on measuring and working with CAC, since this is not the core competence of a classic product manager. On the other hand, LTV is of much greater interest and is precisely the core competence of any product manager.
LTV is a key metric that reflects the value (benefit) of your product to your users and customers. It is this metric that should be at the forefront when working on a product.
Although LTV is a great measure of your product’s value, it has one drawback: it is a high-level metric. To understand how to influence it, you need to decompose it into simpler metrics.
Decomposition of LTV into product metrics
Typically, metrics are tied to key points in the user’s lifecycle in a product. Therefore, we create the ability to track the success of users in the app and find bottlenecks that require attention.
I usually track a user’s journey through a product in terms of engagement and monetization.
Engagement is described by the following stages in the user’s life cycle:
- Activation
- Stickiness (how actively the app is used)
- Long-term retention (how many users continue to use the product after a month, two months, etc. after registration)
Monetization is described by the following sequence of stages in the user’s life cycle:
- Activation in the app
- Seeing a paywall
- Making first purchase
- Making second purchase
…
Below I have provided the metrics corresponding to each of the stages of the user life cycle in the product (metrics may differ for different products):
- Activation in the app (percent of users who completed the tutorial or performed a key target action tied to getting value in the product, e.g., added their first friends, got the first feedback on the post created, got the first match or good chat in the dating app)
- Sticking in the app (percent of users who reached level N or, for example, added N friends: the number of N is determined empirically)
- User saw a purchase offer (percent of users who saw a purchase offer)
- User made their first purchase (percent of users who made in-app purchases, average sum of the first purchase)
- User made a repeat purchase (percent of users who made repeat purchases, average sum of repeat purchases, average number of repeat purchases)
- Retention (percent of users who use the application a month, two, three, four after registration)
All of these metrics ultimately affect LTV. Each product may have its own unique characteristics, but for most, these baselines/metrics will work.
Product metrics and how they affect LTV
Let’s take a closer look at the product metrics described above and how they affect LTV using an abstract game as an example.
In-app activation
In any game, the user first walks through a tutorial and learns the game’s mechanics. Those who don’t complete the tutorial will probably not continue to play, and by extension, pay. That is why it is critical for us to track the proportion of users who successfully complete this stage.
It is also useful to keep track of the proportion of users who complete a series of targeted actions at the end of the tutorial (which means they learned the game and can play on their own). This metric will reflect how well the learning process is designed.
The user is “sticking” to the app
Users usually don’t spend money on a game if they’re not addicted to it. That is why we need to track the proportion of users who stick to the app. To this end, we measure the proportion of users who have reached level N or those who have logged in to the app more than five times within a week of installing it.
Usually, the metric for measuring stickiness is determined empirically.
The user saw a purchase offer, made the first purchase
One of our goals is to generate income – this is key to make most of the acquisition channels work. So we need to incentivize the first in-app purchase. But the purchase is made from a specific screen of our application (for example, from the store screen), so it is necessary to track the proportion of users who saw this screen.
If the sale screen is seen by 10 percent of incoming users, then this automatically puts a cap on the proportion of users who can make the first purchase in our game.
Repeat purchases
The first purchase is good, but financially successful products tend to have a high rate of repeat purchases. Often the first purchase is an indication that the user has confidence in the app. If the user is satisfied with the result, then she will probably make a second purchase.
Therefore, another important metric becomes the proportion of users who make repeat purchases. Also relevant is the average number of repeat purchases per user.
Retention
For users to have a chance to make several purchases, they must continue to play our game for a long time and not leave it after the first day. To track this phenomenon, we will measure retention.
Building product analytics and an example of using cohort analysis
The easiest way to implement product analytics is to create funnels for each of the events described above. In most cases, you will end up with a monetization funnel and a user engagement funnel.
Next, you will need to compare the target metrics for user cohorts based on the week they came to the app. Amplitude and Mixpanel are ideal tools for such analytics. But you can easily do this with SQL or Python too.
Here we will use cohort analysis for product analytics. Using cohort analysis will deepen your understanding of the product and how it is used over time.
We will form user cohorts based on the week they first came to the application. For simplicity, only the following metrics are considered in the example: CAC, LTV, retention, percent of users who made their first purchase, and percent of users who made a second purchase. Also, for simplicity, the cohorts were not segmented by any additional factors.
We will also assume that users in cohorts are similar and there are no other factors that impact user behaviour (for example, seasonality). These are the things that you should control yourself when using cohort analysis. Based on these assumptions the changes that we see in the data can be the result of only product changes or randomness.
Let’s get started. Below is a table of cohort analysis of the product in question (think of it as a game). Check out the table.
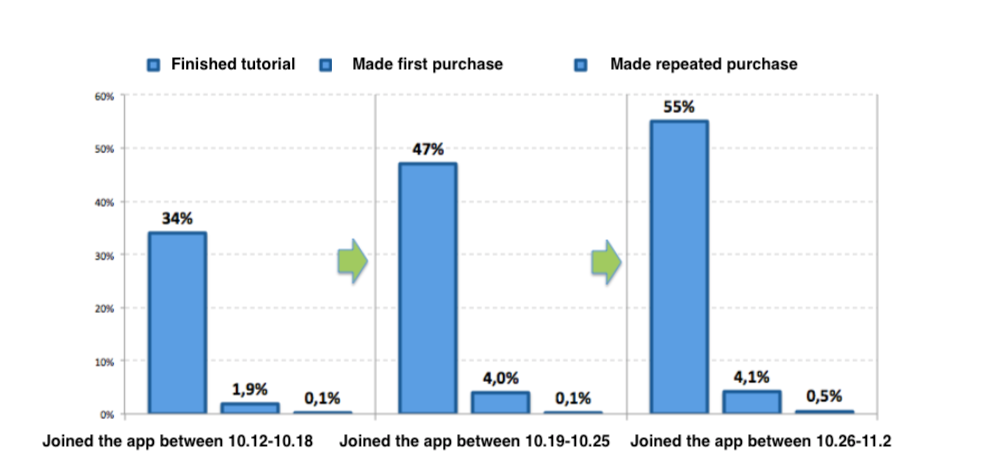
In the first week, 3,000 users came to the first version of our app. At the end of Week 0, 25% of them completed the tutorial, but no one paid yet. By the end of Week 1, another 5% completed the tutorial (that is, only 30%), while 1.2% made their first purchase. By the end of Week 2, 34% of the cohort completed the tutorial, and 1.4% made their first purchase.
A week later, we released a new version of the app, in which we changed the tutorial. According to the cohort analysis table, the product improved. After four weeks, 47% had already completed the tutorial (against 34% in the previous version). Expanding the monetization funnel at the tutorial level also increased the share of users who made a purchase. Unfortunately, our users do not make repeat purchases, which does not allow the product to break even, even though the promotion team was able to significantly reduce the CAC (albeit by reducing the influx of new users). We spend an average $0.8 on every acquisition while we only earn an average $0.5 from every user after eight weeks.
In the third version of the app, we improved the tutorial and added new in-app purchases to the application, increasing the variety. This allowed us to increase the share of repeat purchases and equalize LTV with CAC.
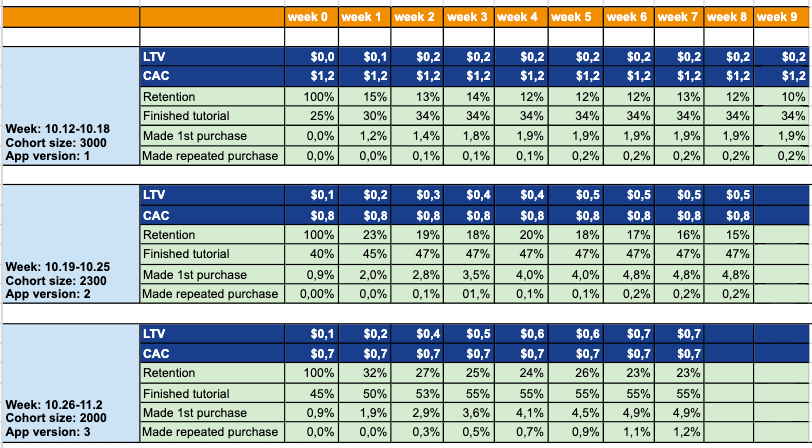
This is how cohort analysis allows us to understand our product, as well as which improvements are working and which are not.
Important: we didn’t calculate if the metric changes are statistically significant, but it is a crucial step of comparing product versions performance using cohort analysis or AB testing.
Summing up
The most difficult stage in working on a product arises when the first metric values for your product are received and the following questions arise:
- Are the obtained metrics good or bad?
- What metric should you prioritize in the next version of the app?
- How do you prioritize the hypotheses you come up with to improve your metric?
The main ideas of the article
- Growth metrics are not suitable for product analytics, since they are influenced not only by the product, but also by marketing/promotion.
- Two key product metrics are LTV and CAC.
- LTV is a high-level metric, so it should be decomposed into product metrics tied to key stages of the user’s life cycle in the application.
- The essence of cohort analysis is to track the key metrics of each cohort over time.
- Cohort analysis allows you to objectively compare different versions of the product and assess the impact of changes on the product.


