Making smart activation decisions is much easier when you have a map of the customer journey from first encounter to the “aha moment”.
Because most teams don’t have this kind of Customer Journey Map, they have a limited understanding of how their product’s value is felt. Therefore, they lose the ability to shape this process in a thoughtful way.
This article will teach you to build a Customer Journey Map from first encounter to an “aha moment” reflecting the product’s value, and show why CJMs give a better way to think about the activation process.
→ Test your product management and data skills with this free Growth Skills Assessment Test.
→ Learn data-driven product management in Simulator by GoPractice.
→ Learn growth and realize the maximum potential of your product in Product Growth Simulator.
→ Learn to apply generative AI to create products and automate processes in Generative AI for Product Managers – Mini Simulator.
→ Learn AI/ML through practice by completing four projects around the most common AI problems in AI/ML Simulator for Product Managers.
All posts from the series
01. When user activation matters and you should focus on it.
02. User activation is one of the key levers for product growth.
03. The dos and don’ts of measuring activation.
04. How “aha moment” and the path to it change depending on the use case.
05. How to find “aha moment”: a qualitative plus quantitative approach.
06. How to determine the conditions necessary for the “aha moment”.
07. Time to value: an important lever for user activation growth.
08. How time to value and product complexity shape user activation.
09. Product-level building blocks for designing activation.
10. When and why to add people to the user activation process.
11. Session analysis: an important tool for designing activation.
12. CJM: from first encounter to the “aha moment”.
13. Designing activation in reverse: value first, acquisition channels last.
14. User activation starts long before sign-up.
15. Value windows: finding when users are ready to benefit from your product.
16. Why objective vs. perceived product value matters for activation.
17. Testing user activation fit for diverse use cases.
18. When to invest in optimizing user onboarding and activation.
19. Optimize user activation by reducing friction and strengthening motivation.
20. Reducing friction, strengthening user motivation: onboarding scenarios and solutions.
21. How to improve user activation by obtaining and leveraging additional user data.
Why it’s important to map the customer journey from first encounter to activation
A team-wide understanding of the activation process
Most people at a company, and even most people on an activation team, do not have a full understanding of how a product’s activation mechanisms work. They likely have only fragments of the bigger picture.
If your product is more complex than a flashlight app, then the customer journey will probably be complex and multibranched. The branches will depend on the type of user and device, how these branches intertwine, and the people involved in activation.
When the entire team has the same understanding of the customer journey, it becomes much easier to communicate and prioritize. Instead of arguing about how something works, the team can refer to the Customer Journey Map and immediately see how proposed changes would impact different processes. The quality of ideas, as well as their success rate, grow as a result.
A useful exercise for thinking about activation
Building a CJM is also a good exercise for getting the big picture. You zoom out and take a fresh look at your product. This exercise can help to quickly notice potential problems and opportunities for product improvement. Often the product manager has a very different mental picture of activation compared to the actual journey taken by users. Building a CJM based on user activation patterns helps to close this gap and create a more realistic picture.
A history of changes and their impact on activation
Product teams want to believe that, if they ever need to, they will effortlessly recall what changes they made and when, which experiments they’ve tried, and what the results were.
But in reality, people quickly forget about old projects and their impact on customer behavior and key metrics. Try it: see if you can remember even half of the projects your team has done in the last six months. Not so easy!
It’s not just a problem of someone having a bad memory, either. Past experiments and their results also get forgotten due to simple team turnover, as old-timers move on and newcomers join.
Tracking changes and their effects on a CJM is a great investment in consistency and continuity of activation efforts.
A foundation for applying powerful activation tools
In future articles we will be discussing tools for looking at the activation process from all sorts of angles:
- Applying tax/benefit analysis to each step of the activation flow. Does a particular step offer value to users or does it just sap energy?
- Analyzing added value for each screen. How much value does each on-screen interface element communicate to the user?
- Identifying “aha moments” and looking for ways to accelerate time to value.
- Looking for steps where the user encounters friction, as well as ways to remove it.
Putting this toolkit into practice requires a high-fidelity map of the customer journey, all the way from first encounter to the “aha moment”.
Creating a Customer Journey Map, step by step
Making a CJM is not for the easily intimidated. We will build our CJM here iteratively, taking just one piece of the process at a time.
Convenient software options for this include Miro and FigJam.
Below we first describe how to make one and then provide an example of how it works in practice.
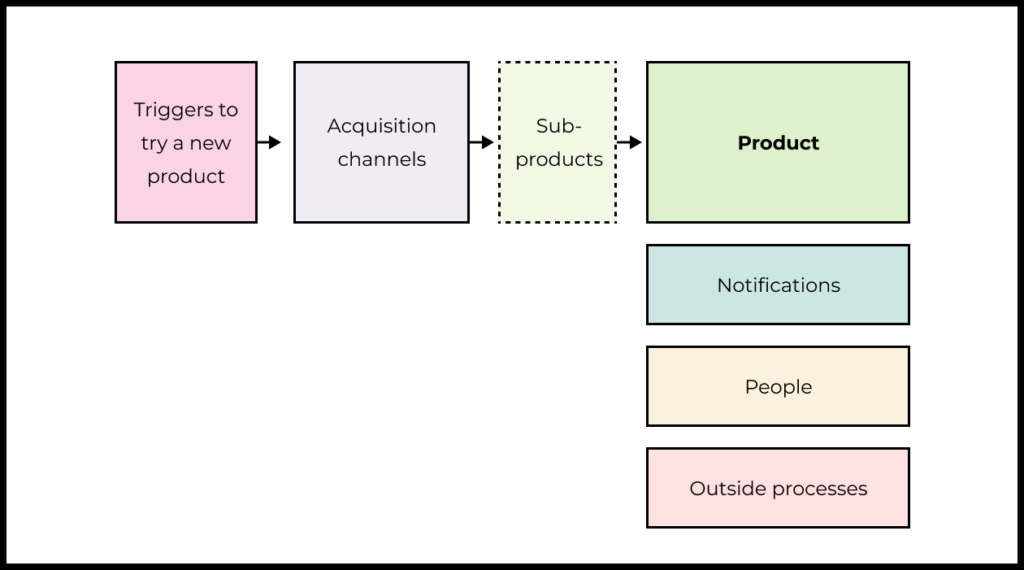
Product-level activation: from sign-up to “aha moment”
Let’s start with the straightforward part: mapping the path of a new user inside the product, from sign-up to activation and an “aha moment”.
For many teams, their concept of activation both begins and ends here.
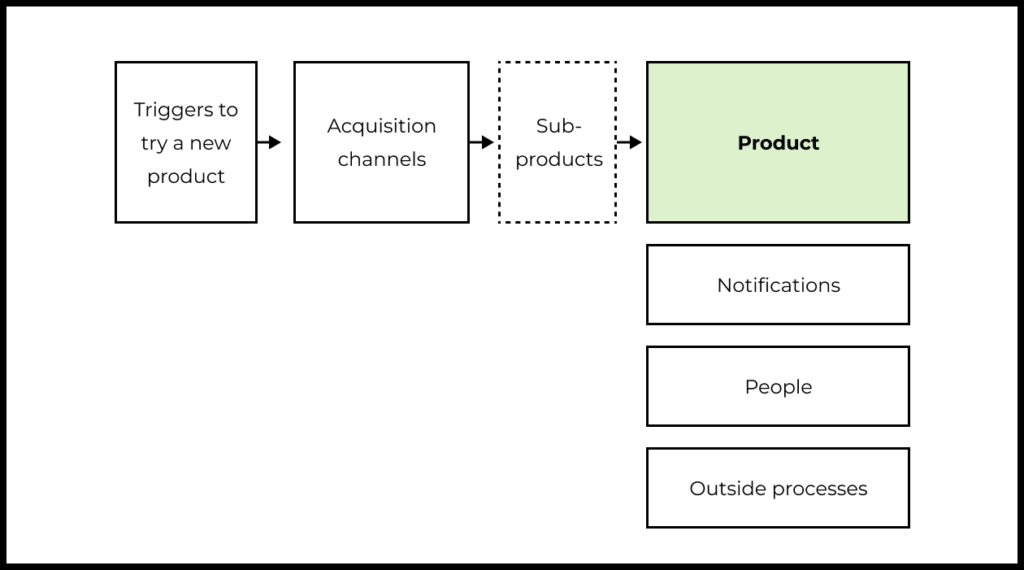
Try making a map yourself by building a chart in Miro or FigJam with all the main steps (don’t forget to connect them with arrows).
At this point, there’s no need to focus on interface details like specific buttons or sign-up forms. We will handle that separately.
Important things to remember:
- If the product journey is different for different users, then map multiple journeys. For B2B products, for example, the journey of the first user at a company will be different from the journey of later users.
- If the product has different journeys that are dependent on platform, device, or other factors, reflect all of these.
GoPractice example
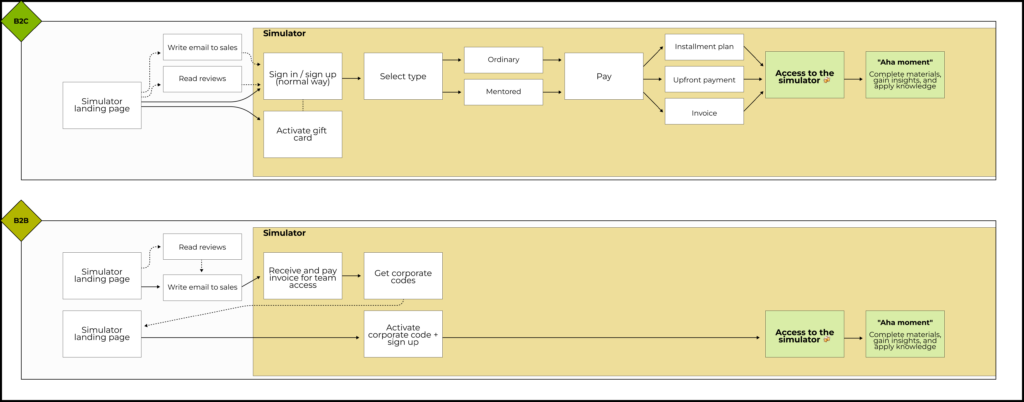
We used Figma to make the chart below. The chart describes the product activation process for both B2C and B2B.
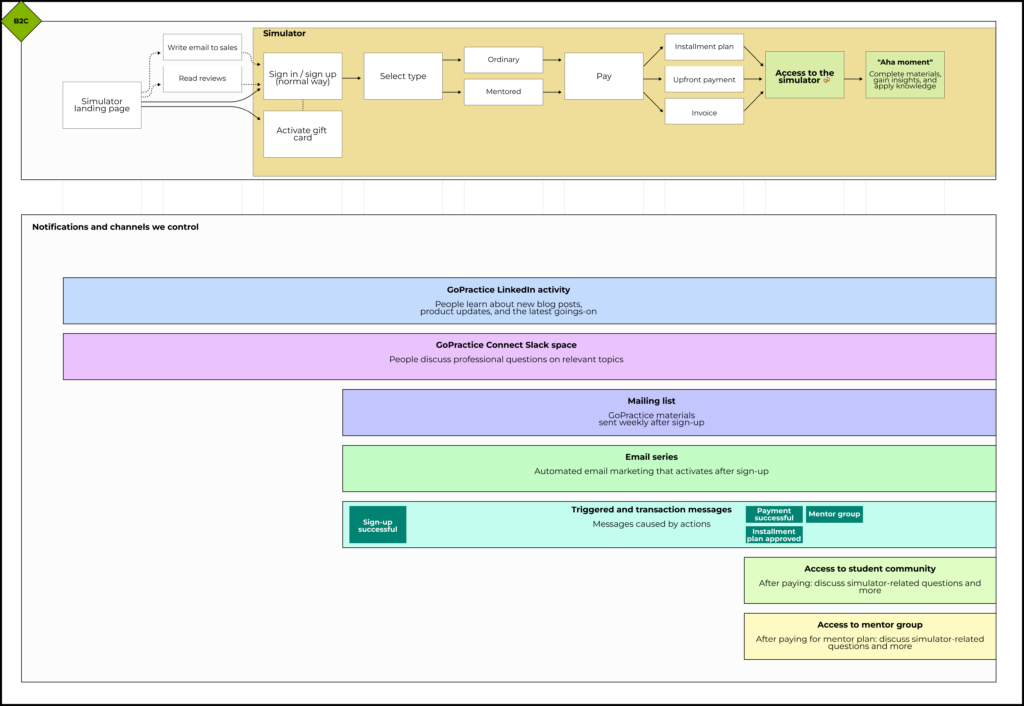
Activation at the notification level
As we’ve noted already, activation for most products does not stop at just the in-product experience.
Most products will have notifications—emails, push notifications, text messages, browser notifications, and social media posts—to facilitate activation.
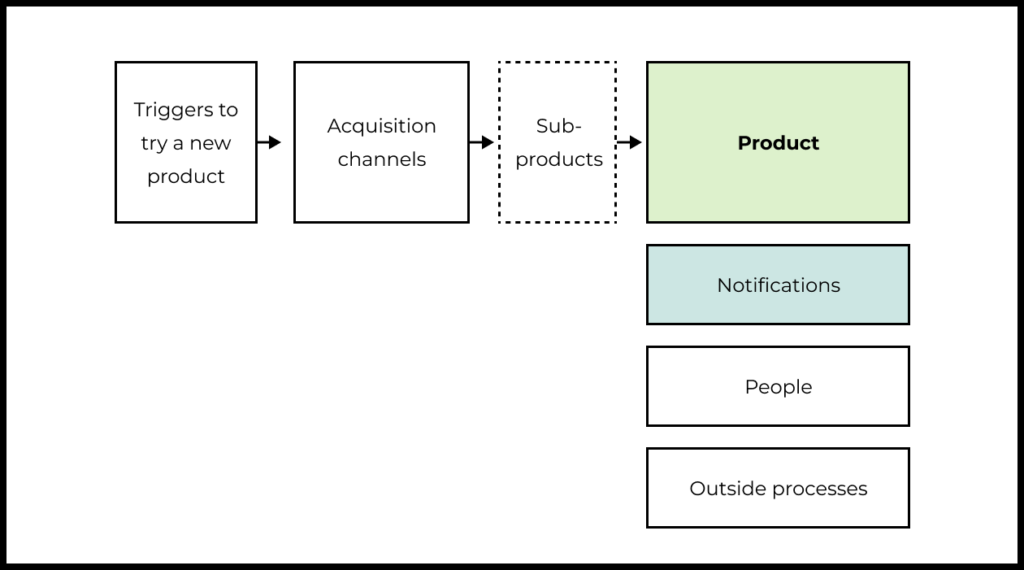
See which notification types are currently used for activating users in your product. Add each of these types to your map in parallel to the product flow and indicate what is happening there.
GoPractice example
Here we have added a notification layer for the GoPractice simulator. For brevity, we’ve included just one (B2C) of the two use cases.
Human involvement in activation
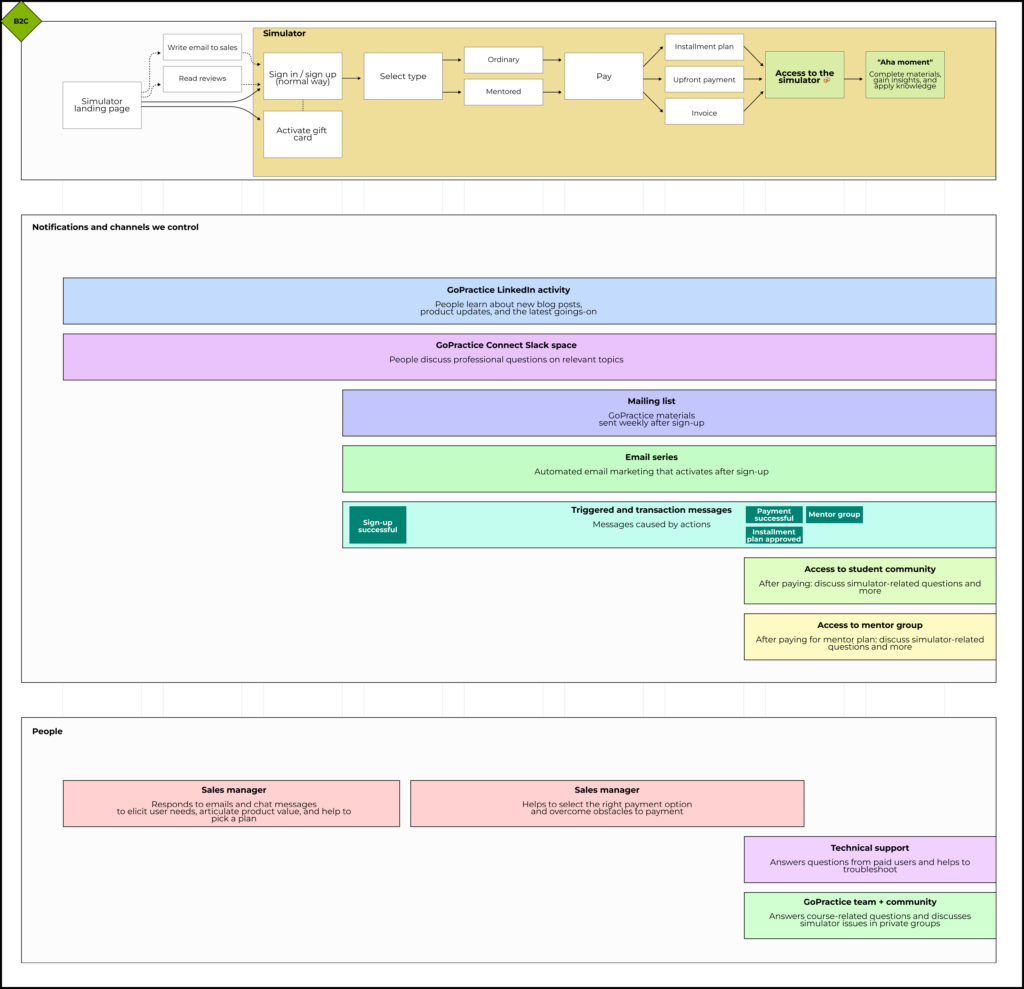
The user activation process can involve people: these include sales managers, Customer Success Managers, community members, and technical support.
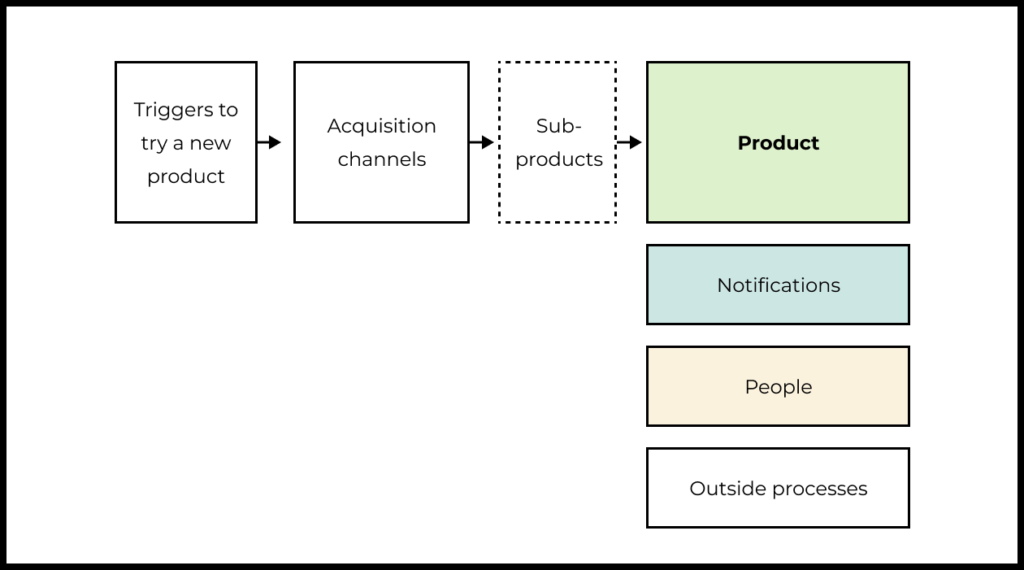
Determine where human involvement affects the user activation process and, on your map, add it in parallel to the product flow and notifications.
If this participation depends on the user type or other circumstances, reflect this too. Sometimes people will be involved in potential sales to large companies but not to small ones, for example.
GoPractice example
Here we show how GoPractice’s people are involved in the activation process for B2C clients.
Catching what’s in your blind spot
For many products, important parts of the process for delivering and recognizing value occur in blind spots where you don’t have visibility or direct control.
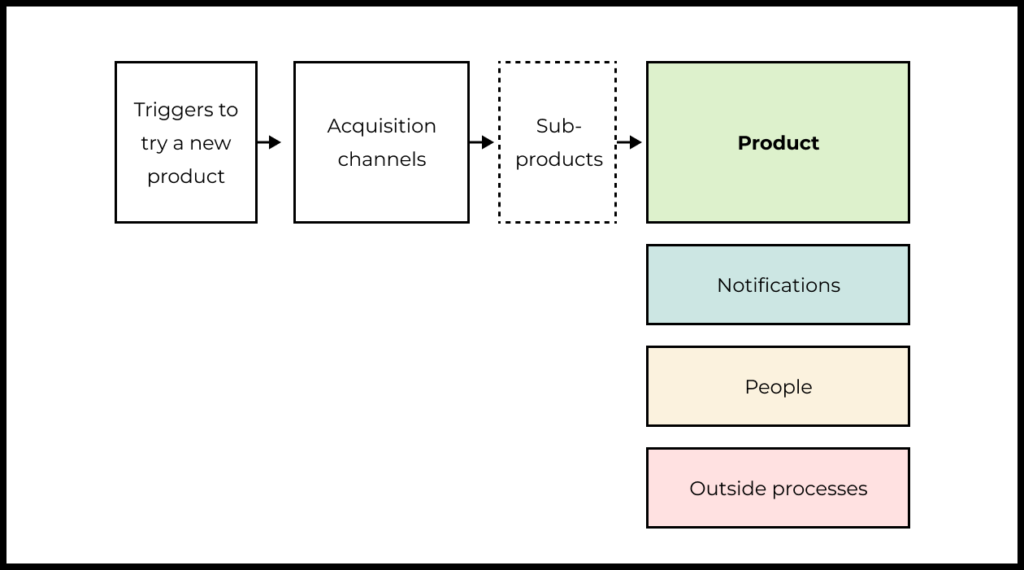
For instance, this could be discussion of your product on the client side, sign-off from an executive or security team, competitive analysis, or reviews of your product online.
Other uncontrollable factors can have a critical impact on the user experience. Marketplace users are sensitive to message tone, delivery speed, and quality of products from merchants, for example.
In the case of software, important steps in the setup process occur outside of your product’s interface. Connecting third-party services, enabling integration, or providing access privileges to data hosted by a third party are important steps not under your control.
If you know that these processes exist, add them to the map.
Even though these processes aren’t visible in your analytics, they often contain important levers for impacting user decisions. You may not have direct mechanisms for doing so, but often you will have indirect ways of nudging.
For example, if your users are checking online reviews, then an important mechanism for activation would be to encourage satisfied users to share their experience.
If many of your users are having to manually transfer data from a third-party service, you may want to work directly with the service in question to enable smooth integration.
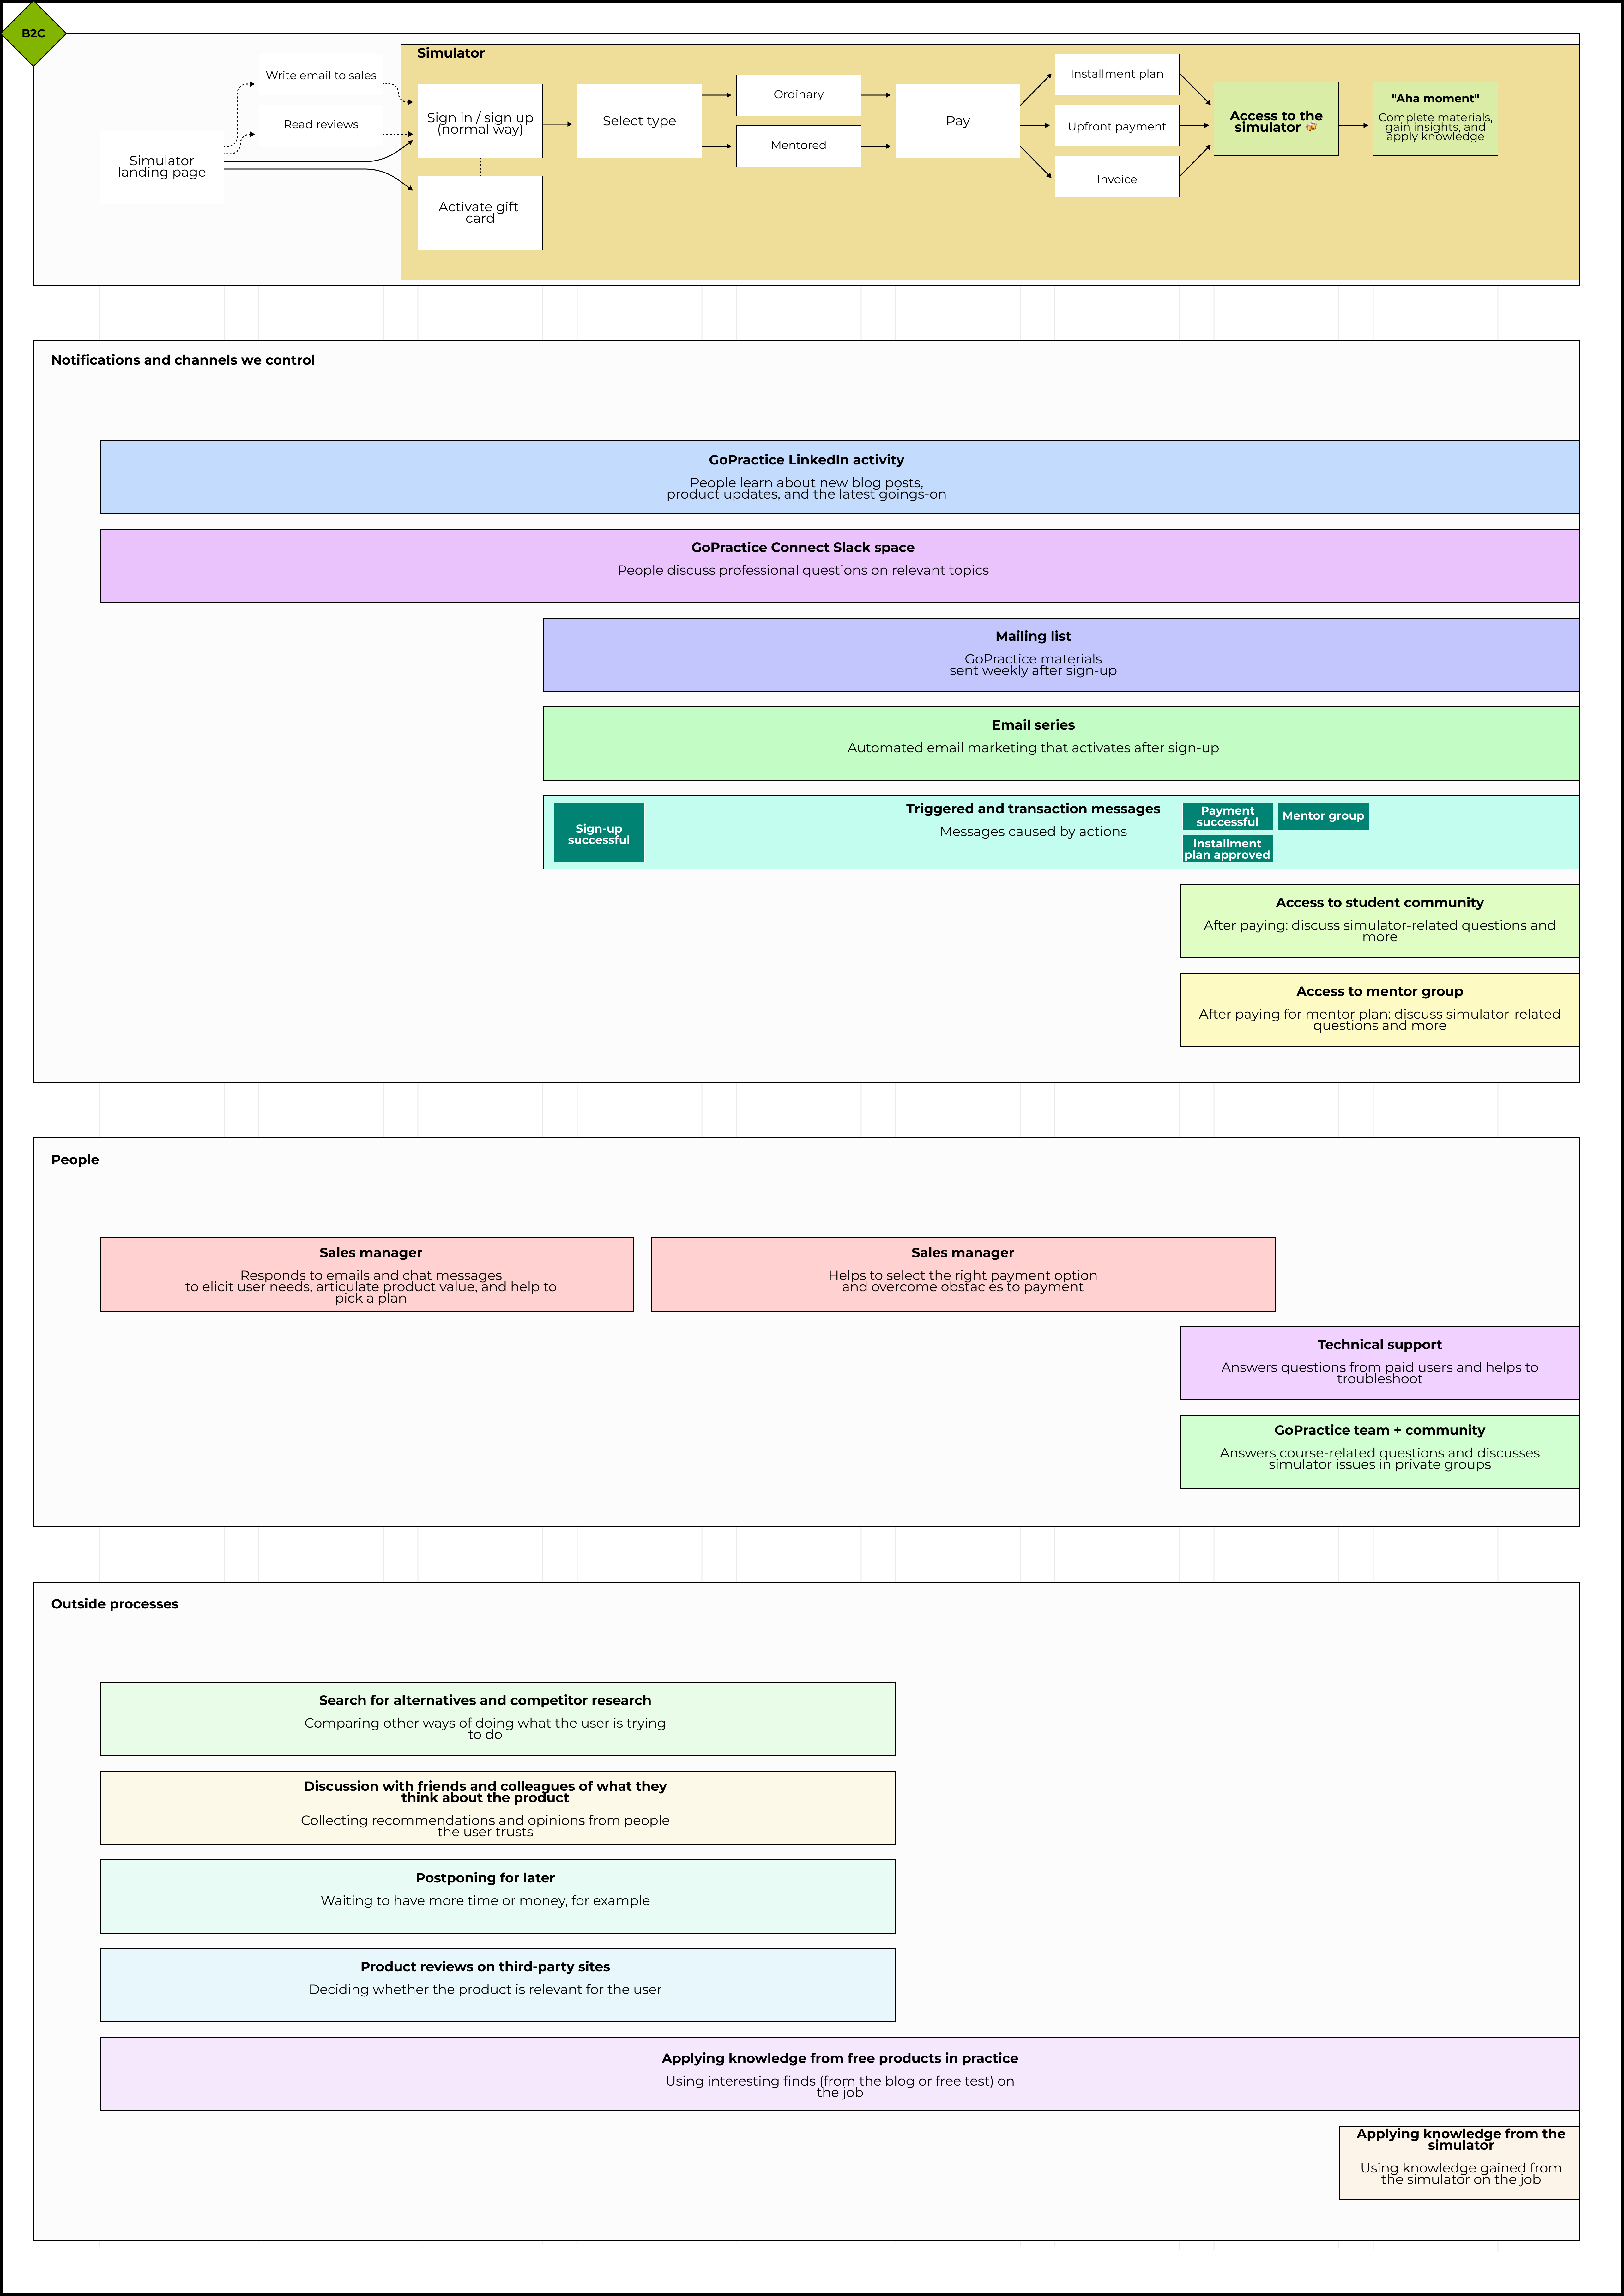
GoPractice example
Now we’ve added blind spots and processes occurring outside of the product that are relevant to the activation process.
Activation steps prior to sign-up
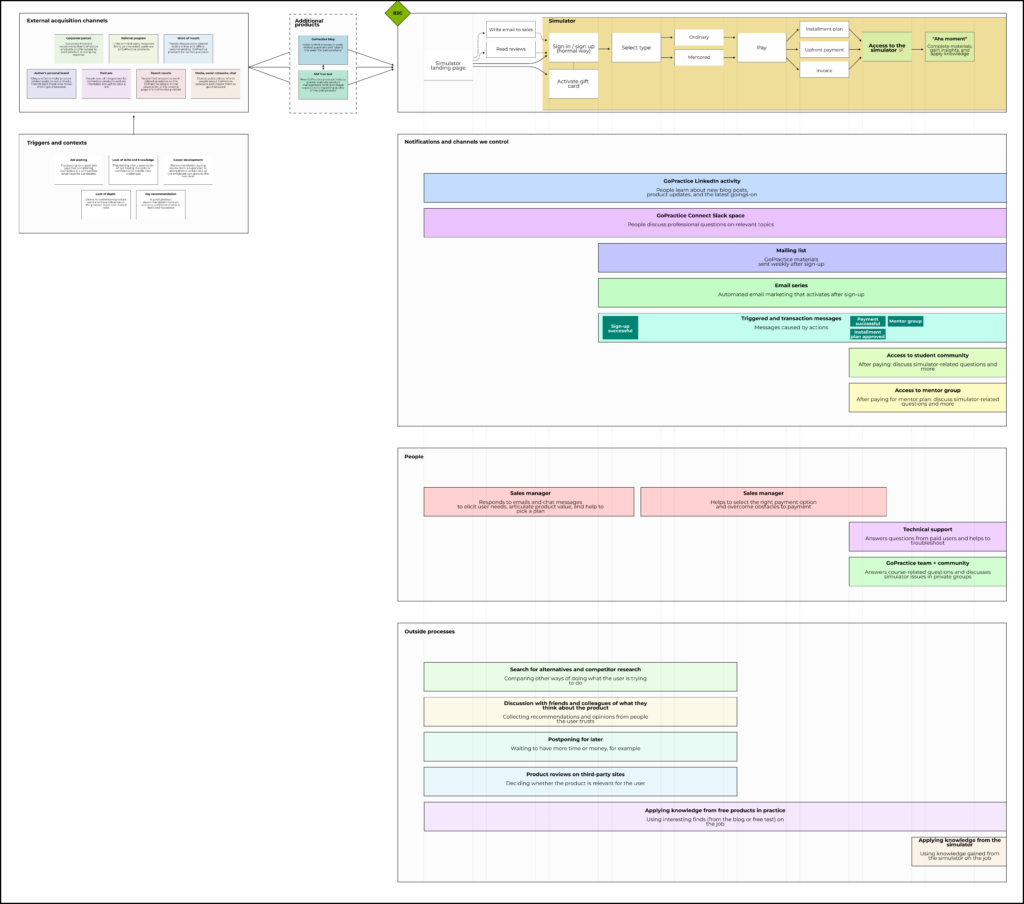
Activation starts long before a user ever signs up. Add the main channels for user acquisition and the steps that users go through.
If additional products are used in the acquisition funnel, show where exactly and how they affect the overall process.
Also be sure to add any triggers and contexts when potential users might become interested in the product and take the first step to learn about it.

GoPractice example
We have added the triggers and contexts that precede or accompany user acquisition. The map now also includes related products that are part of the user activation journey.
Finding CJM gaps with session analysis
By now, you should have a “skeleton” that visualizes the customer journey from first encounter to “aha moment”.
The map will still likely have gaps or missing steps. To find these, we recommend doing session analysis for a few dozen new users. We’ve detailed the right approach to session analysis in our previous article.
Such analysis validates Customer Journey Maps, tests them against reality, and suggests anything that you’ve overlooked.
Conclusion
Having a CJM will synchronize your team’s understanding of how activation works at the product level and works as a powerful tool for any future efforts to re-think or re-design activation.
In our next article we will cover how to use CJMs to analyze user activation for different use cases (or “jobs”, in JTBD terminology).


