
We have discussed in the previous articles why it’s important to reduce friction and strengthen motivation for users throughout the activation flow.
Here we will go into depth with what we call the “tax/benefit framework”. This is a way of conceptualizing changes in motivation over time as the user goes through the activation flow. By performing this kind of analysis, you can better structure activation, motivate new users as you guide them to an “aha moment”, and turn “tax” steps into “benefit” steps.
Other approaches to analyzing user motivation—such as Darius Contractor’s Psych or Ilia Krasinskii’s—share some similarities with the tax/benefit framework, but are implemented differently.
→ Test your product management and data skills with this free Growth Skills Assessment Test.
→ Learn data-driven product management in Simulator by GoPractice.
→ Learn growth and realize the maximum potential of your product in Product Growth Simulator.
→ Learn to apply generative AI to create products and automate processes in Generative AI for Product Managers – Mini Simulator.
→ Learn AI/ML through practice by completing four projects around the most common AI problems in AI/ML Simulator for Product Managers.
All posts from the series
01. When user activation matters and you should focus on it.
02. User activation is one of the key levers for product growth.
03. The dos and don’ts of measuring activation.
04. How “aha moment” and the path to it change depending on the use case.
05. How to find “aha moment”: a qualitative plus quantitative approach.
06. How to determine the conditions necessary for the “aha moment”.
07. Time to value: an important lever for user activation growth.
08. How time to value and product complexity shape user activation.
09. Product-level building blocks for designing activation.
10. When and why to add people to the user activation process.
11. Session analysis: an important tool for designing activation.
12. CJM: from first encounter to the “aha moment”.
13. Designing activation in reverse: value first, acquisition channels last.
14. User activation starts long before sign-up.
15. Value windows: finding when users are ready to benefit from your product.
16. Why objective vs. perceived product value matters for activation.
17. Testing user activation fit for diverse use cases.
18. When to invest in optimizing user onboarding and activation.
19. Optimize user activation by reducing friction and strengthening motivation.
20. Reducing friction, strengthening user motivation: onboarding scenarios and solutions.
21. How to improve user activation by obtaining and leveraging additional user data.
What the tax/benefit framework is
At its core, the framework asks a single question of each key step on the user’s journey to value: Does the step act like a “tax” (take energy from the user) or a “benefit” (give energy)? While a step can be neutral, we should lean toward considering that step a “tax” when the user doesn’t see how they benefit from it.
Making a graph of the ups and downs of a new user’s energy level as they activate makes it obvious where the user encounters a lot of friction or gains motivation to keep going.
Based on this graph, you can then work to improve activation: reorder the steps, overhaul them, or make local optimizations. Such information is also helpful for measuring how much motivation and intent users need to have before signing up, which will impact your choice of mechanisms for acquiring new users.
Applying the tax/benefit framework
To get started with the framework, you need to have a Customer Journey Map ready. We’ve covered how to build a CJM in the previous materials. You may find it handy to refer to our approach to designing activation by working “backwards” from value.
Here is our recommended approach for applying the tax/benefit framework:
- Select a job-to-be-done (use case) that your product’s users have.
- Estimate how much motivation the user has when trying your product for the first time. Include their prior experience: how they learned about the product and what triggered them to try it out.
- For each step, categorize and score elements based on whether energy is given or taken.
- Calculate the net impact of each step on user motivation.
- Make a graph of how motivation fluctuates as the user proceeds from learning about the product to reaching an “aha moment”.
We’ll look at each step in more detail and provide an example of how applying the framework might look in practice.
Step 1. Select a job-to-be-done (use case) that your product’s users have
When applying the tax/benefit framework, you should analyze only onе job-to-be-done at a time:
- First, an activation step can be assessed only in the context of what the user is trying to do. Assume that a bank offers cashback for debit cards but not for credit cards, for example. In that case, being asked to choose a bonus cashback category is valuable for debit users wanting to save on purchases. But that same step would probably be a tax for users wanting a credit card, who don’t stand to benefit from cashback in the first place.
- Second, the order of activation steps can change significantly based on JTBD. The user’s product experience and motivation level, therefore, will vary as well.
That’s why tax/benefit analysis should be performed separately for each key JTBD that brings users to your product.
Step 2. Estimate how much motivation the user has when trying your product for the first time. Include their prior experience: how they learned about the product and what triggered them to try it out
Now you should try to determine what the user’s initial level of motivation is. This level depends on many factors.
A severe toothache will give much stronger motivation to visit a dentist than, say, a reminder to come in for an annual cleaning.
Similarly, if a trusted mentor has recommended that you check out a certain educational course, you will be more motivated than someone who learned about it from an ad.
Here are questions to get started thinking about initial motivation:
- How urgent is the problem in the user’s life? This will depend on the user’s job-to-be-done and context.
- How tailored is the product to solving that problem? Was the product designed for this or is it a “happy accident” (incidental use case)?
- How large is the product’s added value compared to the alternatives? Is the product an order of magnitude better, or just a little bit better?
- How much does the user trust your product, brand, and company?
- Does the user have the skills and knowledge necessary to obtain value from your product?
Based on these answers, try to estimate the user’s initial motivation level on a scale of 1 (completely uninterested) to 100 (highest possible motivation).
Then adjust this number based on the user’s prior experience:
- How did the user learn about your product? Which channel was involved?
- What was the trigger to start using the product?
- Add other potentially important prior experiences.
If you notice groups or clusters of users with different levels of initial motivation, you should separate them into different JTBDs. These users will likely have different contexts for their JTBDs.
Step 3. For each step, categorize and score elements based on whether energy is given or taken
You did this work already when you analyzed methods for reducing friction and strengthening motivation. This step is similar, except that you will be estimating impacts on user motivation.
Elements that take energy tend to involve:
- Extra work. Examples: filling out a form, taking a photo, or inviting colleagues.
- Cognitive burdens. Examples: comparing and choosing rate plans, reading terms and conditions.
- Confusion. Examples: the user doesn’t know what a certain function does, or they encounter confusing or vague text that makes them doubt the product is intended for their JTBD.
- Doubt and mistrust. Example: an app asks the user to authorize access to personal data but the user is worried that doing so will compromise their security.
By contrast, when an element gives energy and boosts motivation, it will offer:
- A feeling of progress, even if the user’s ultimate goal hasn’t been reached yet. Example: a user is setting up a new product and they successfully connect to a third-party service, thanks to which they now see their data there.
- Reassurance that the product is designed for the user’s JTBD. Example: case study about a similar business that used the product to solve a problem like the one the user has.
- Social proof. Examples: reviews from other users, logos of well-known companies.
- Perceived value. Examples: exclusivity, limited quantity or time limit for making a decision, personalized offers and discounts.
- Memorable or exciting sensations. Examples: breathtaking acceleration while test-driving a Tesla, the unboxing of a new MacBook.
To see which activation elements take or give energy, it can help to perform UX tests or manually onboard a few clients.
Then you should estimate the effect of that element on the user’s energy as a specific number. You can assign scores based on intuition or work with your team to standardize these values. Here, we will be working on a scale from –10 (takes most energy possible) to +10 (gives most energy possible).
When you’re assigning scores, it can be good to keep a copy handy of any worksheets you’ve filled out about the product’s objective value and mechanisms for perceiving that value, as well as target actions for each step of the activation flow. These factors shape how each element will ultimately impact the user’s motivation level.
Step 4. Calculate the net impact of each step on user motivation
So far we’ve analyzed the user experience at each step of the activation flow and estimated the net impact of these elements on motivation. For this step, we add up element scores to measure each step’s overall effect on activation.
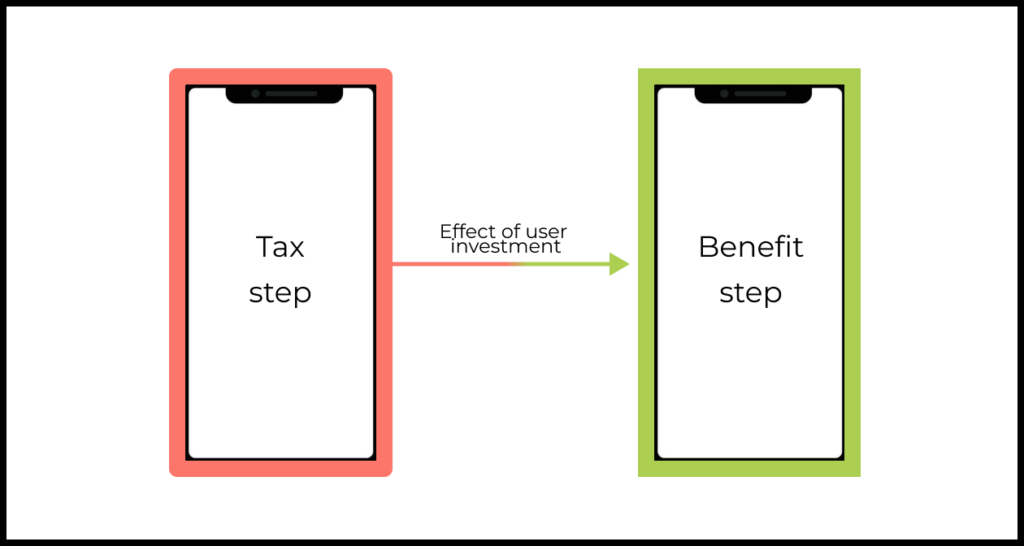
Then we can assign each activation step to one of three categories:
- Tax step, which requires a substantial investment of energy from the user to complete
- Benefit step, which strengthens motivation by surfacing the product’s value, giving a feeling of progress, or bringing the person closer to solving their JTBD
- Neutral step, if there are no clear “tax” or benefit” elements for the step, or if these elements cancel each other out
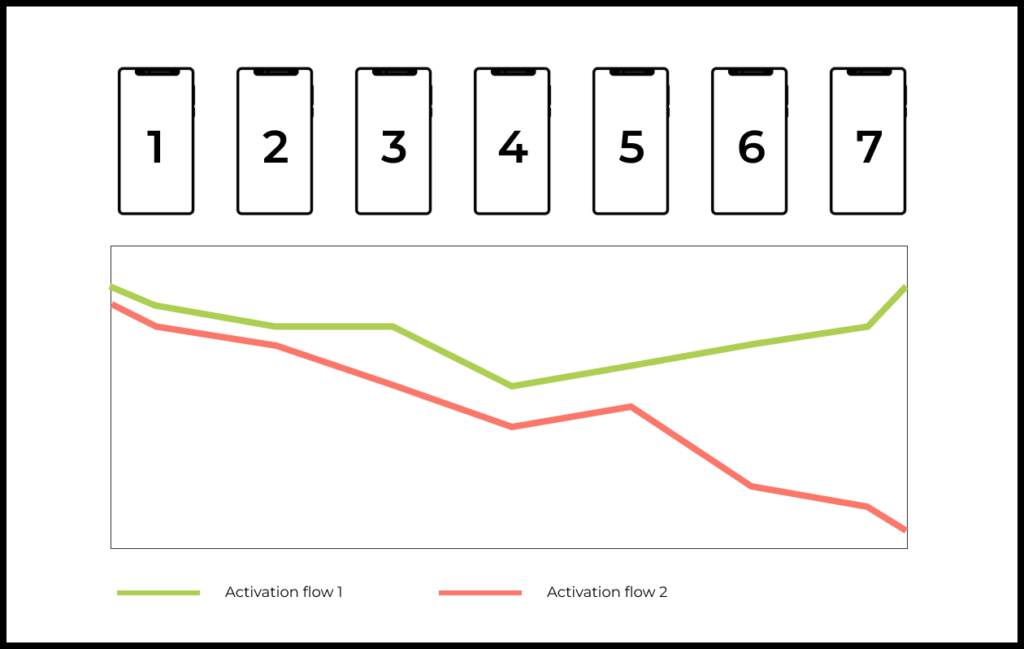
Step 5. Make a graph of how motivation fluctuates as the user proceeds from learning about the product to reaching an “aha moment”
You have collected all the information needed to visualize fluctuations in user motivation, starting from when they learn about the product to when they reach an “aha moment” for their particular JTBD. You added up all the scores for the elements experienced during each step.
If the numbers on the motivation graph dip below zero, users will likely leave before ever seeing the product’s value.
If motivation is strong, then you will see a curve that is high up on the Y axis. Remember that individual users will always be at different places on a spectrum of motivation.
Applying the tax/benefit framework to a real-world product
Step 1. Select a job-to-be-done (use case) that your product’s users have
As we noted at the start, tax/benefit analysis should always be performed separately for each key job-to-be-done that your users have.
For our example, we’ll use Tinder, the app for finding dates and romantic partners.
Let’s take the following JTBD and user context:
Harry has been hoping to start a relationship for a while, but with no luck so far. His best friend, who recently met someone on Tinder, has recommended giving Tinder a try. Harry’s downloaded the app but has been skeptical of online dating in the past.
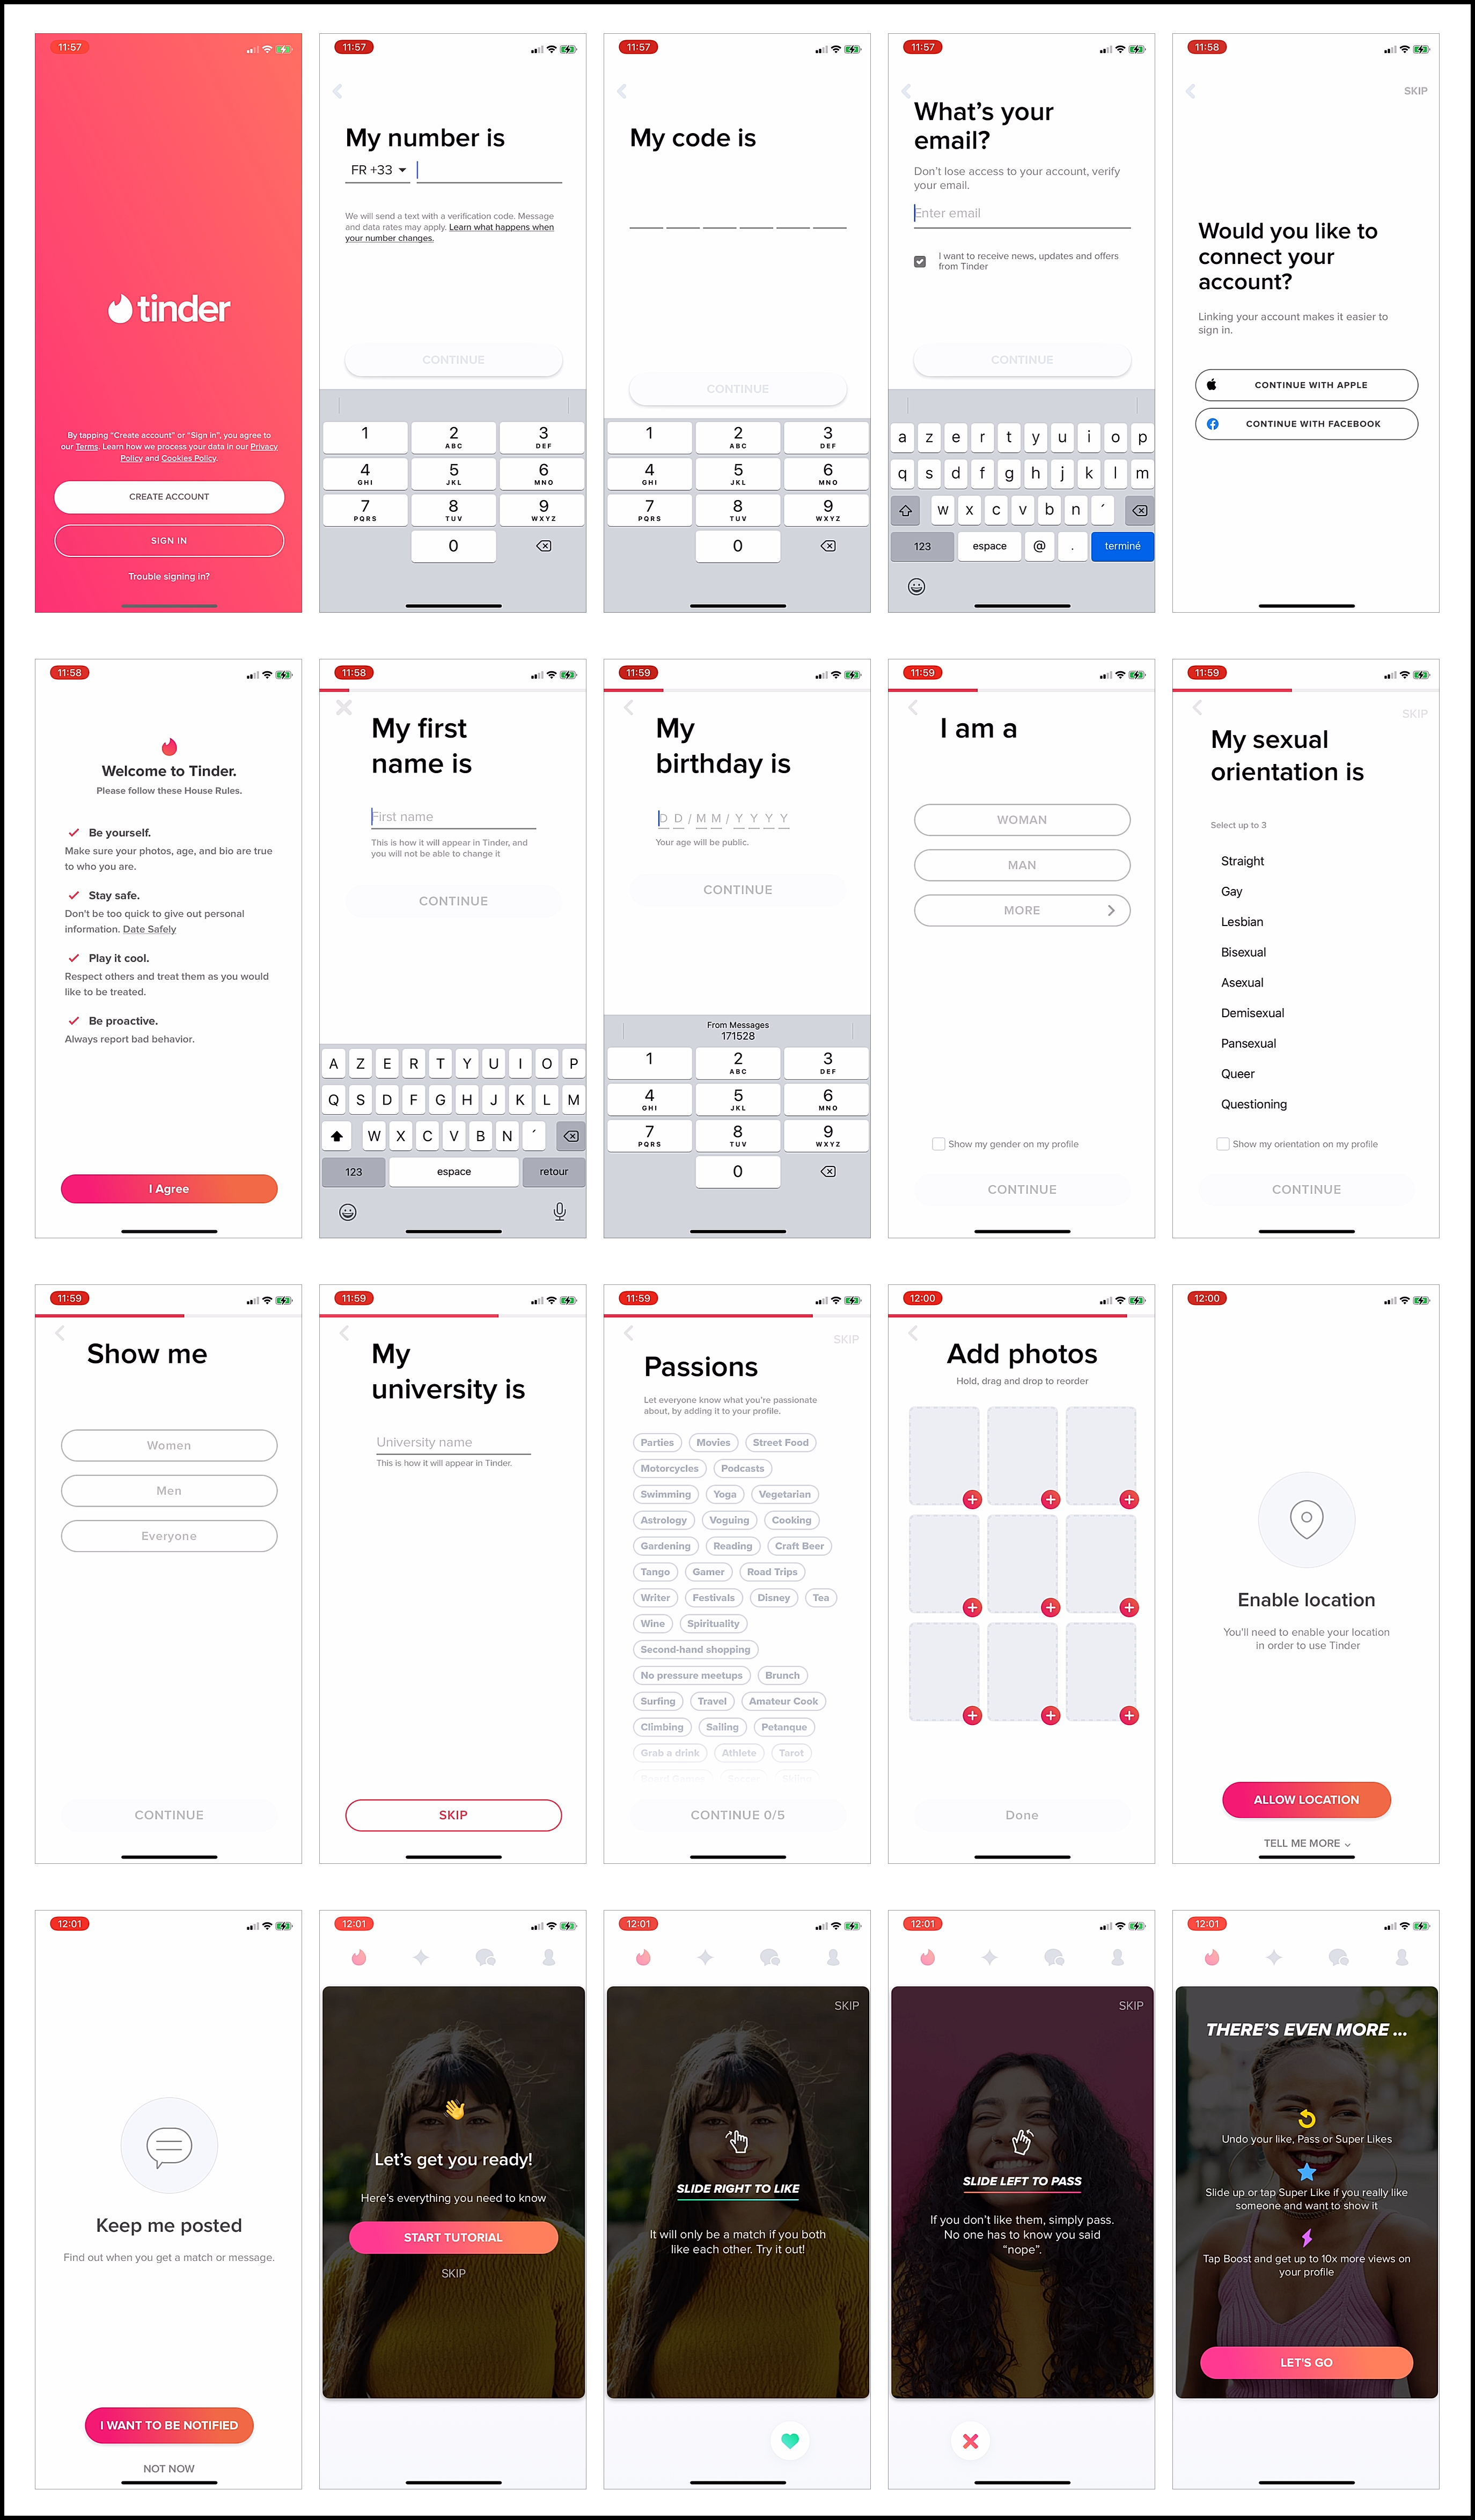
Below are the 20 onboarding screens that Harry has to go through in order to activate. In addition, we’ve included parts of the CJM that precede the product and those occurring after Harry finishes onboarding.
Step 2. Estimate how much motivation the user has when trying your product for the first time. Include their prior experience: how they learned about the product and what triggered them to try it out
We’ll answer a few questions to estimate Harry’s level of initial motivation. We’ll assign a score to each answer:
- Strongly positive answer: 100 points
- Negative answer: 0 points
- In-between answers: from 0 to 100 points
How urgent is the problem in the user’s life?
60 points
Harry has been out of a relationship for a while. He is actively looking for a partner. The problem is fairly urgent for him.
How tailored is the product to solving that problem?
100 points
Tinder is tailored to solving precisely this problem.
How large is the product’s added value compared to the alternatives?
100 points
Alternatives such as meeting someone at work or in a bar haven’t worked out for Harry. Tinder is the only dating service that Harry has heard of.
How much does the user trust your product, brand, and company?
0 points
Harry doesn’t trust dating services. He isn’t sure that this way of meeting people is right for him.
The only reason he’s prepared to give it a try is because of his friend’s successful experience, but he’s still skeptical.
Does the user have the skills and knowledge necessary to obtain value from your product?
100 points
Tinder does not require specialized knowledge or skills to use, but it does require a substantial investment of time and effort to search for and talk with potential partners.
The user’s motivation level is also impacted by how they discovered the product and any prior interactions they’ve had with the brand. As mentioned previously, activation starts long before sign-up.
- Positive prior experience: 100 points
- Negative prior experience: 0 points
- In-between experience: from 0 to 100 points
How did the user learn about your product?
100 points
Harry knew for a long time that some of his friends use (or had used) Tinder. The main acquisition channel is word of mouth. Recommendations from friends have a major impact on motivation.
What was the trigger to start using the product?
100 points
The positive recent experience of Harry’s friend sealed his decision to try out Tinder. This was the trigger for him to install the app.
Now let’s calculate Harry’s average score for these seven questions.
(60 + 100 + 100 + 0 + 100 + 100 + 100) / 7 = 80
Harry’s total initial motivation is 80 points. This number reflects a high level of motivation consistent with his situation.
Step 3. For each step, categorize and score elements based on whether energy is given or taken
Let’s look at the activation flow in the Tinder app.
Activation begins long before sign-up. So far, we’ve analyzed Harry’s job-to-be-done, context, and journey prior to experiencing the product (launching the app). This tells us about his initial motivation.
80 points
Harry’s initial motivation, which we just measured.
We know the triggers and context for Harry’s job-to-be-done of finding a date. He hasn’t been in a relationship for a while and feels like he’s ready to start looking again. His friend’s positive experience inspired him to look at this way of solving his JTBD.
The main acquisition channel for Tinder is word of mouth. Harry kept hearing about the app when hanging out socially, and now his friend’s personal experience has confirmed the product’s value.
Before we start analyzing the activation flow to see which elements give or take energy, we should discuss how we will do this.
We will score each element in the context of its difficulty and duration, relative to motivation levels in the relevant circumstances.
We will almost always be assigning scores on a scale between –10 and +10. This gives a reasonable scale for judging relative changes in motivation, while preventing the distorting effects of having numerous minor hiccups numerically overwhelm initial motivation (or the opposite, if tiny benefits pushed motivation to astronomical levels).
If you use values outside this range, reserve them for only critically large taxes or benefits.
Impact on motivation:
- Critical benefit. >10 points
- Extremely positive. +10 points
- Moderately positive. +5 points
- Slightly positive. +2 points
- Slightly negative. –2 points
- Moderately negative. –5 points
- Extremely negative. –10 points
- Critical tax. <–10 points
Back to our example.
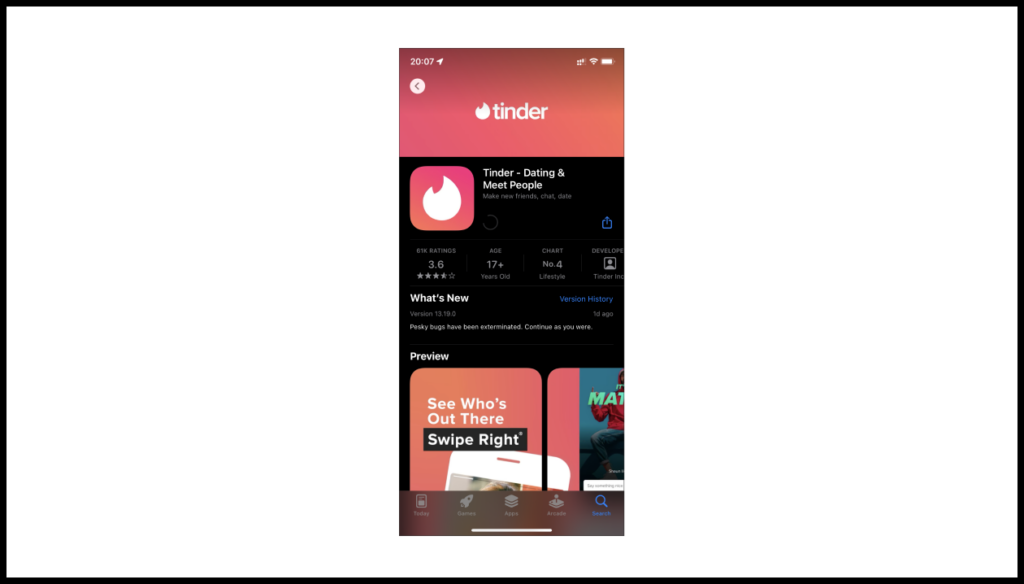
–2 points.
Harry found Tinder on the App Store and installed it. Doing this required extra work from him.
Screen 1. Create account
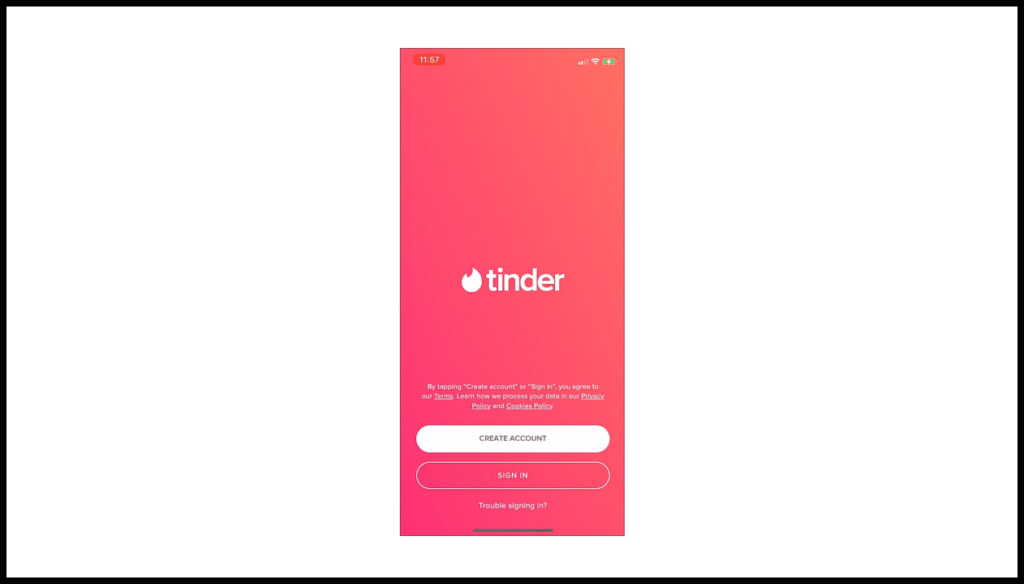
–2 points.
User is prompted to create a new account, which is extra work.
Screen 2. My number is
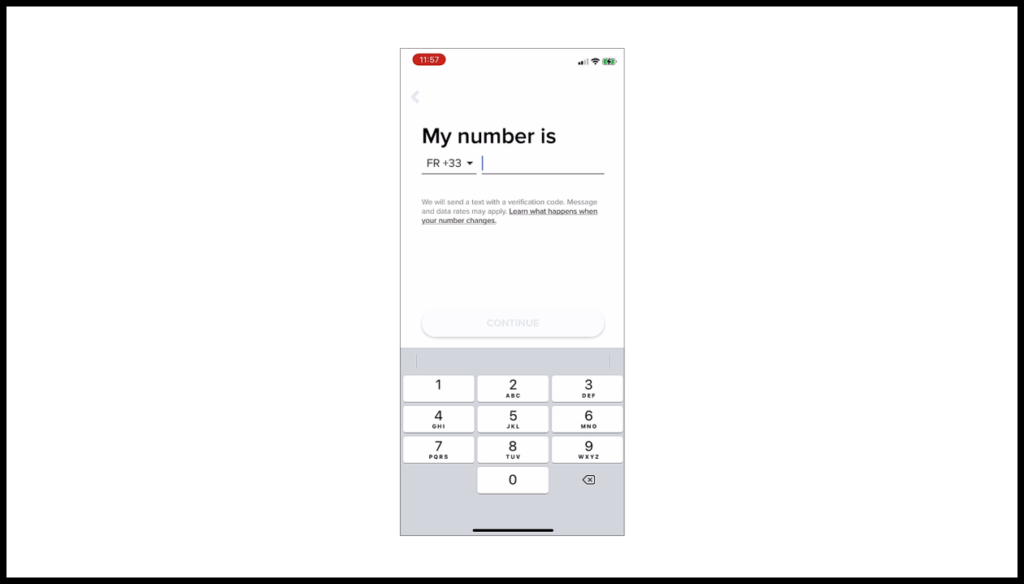
–2 points.
User must enter their phone number to sign up.
Screen 3. My code is
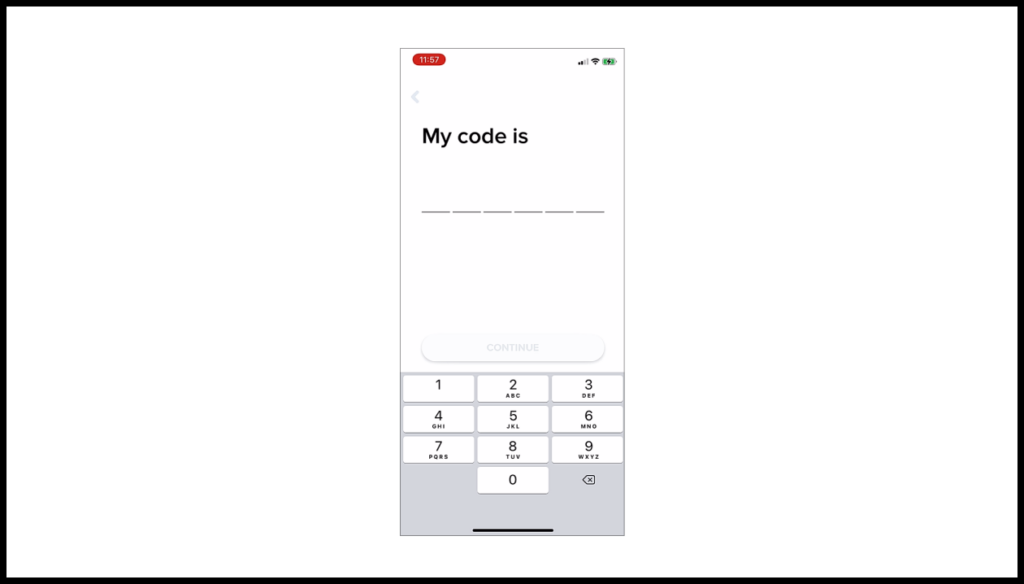
–2 points.
User must enter the confirmation code from a text message.
Screen 4. What’s your email?
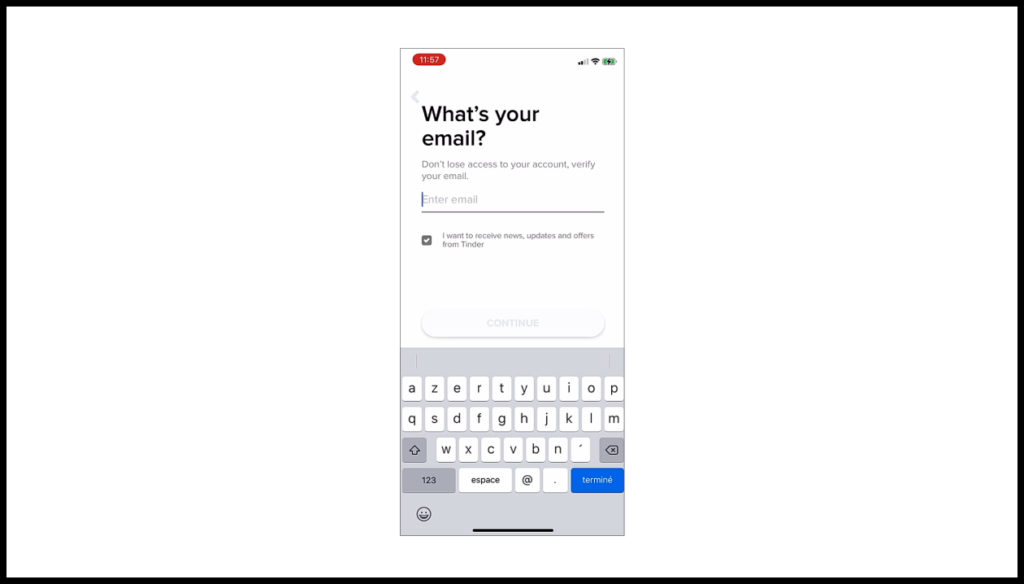
–2 points.
User must enter their email address.
Screen 5. Would you like to connect your account?
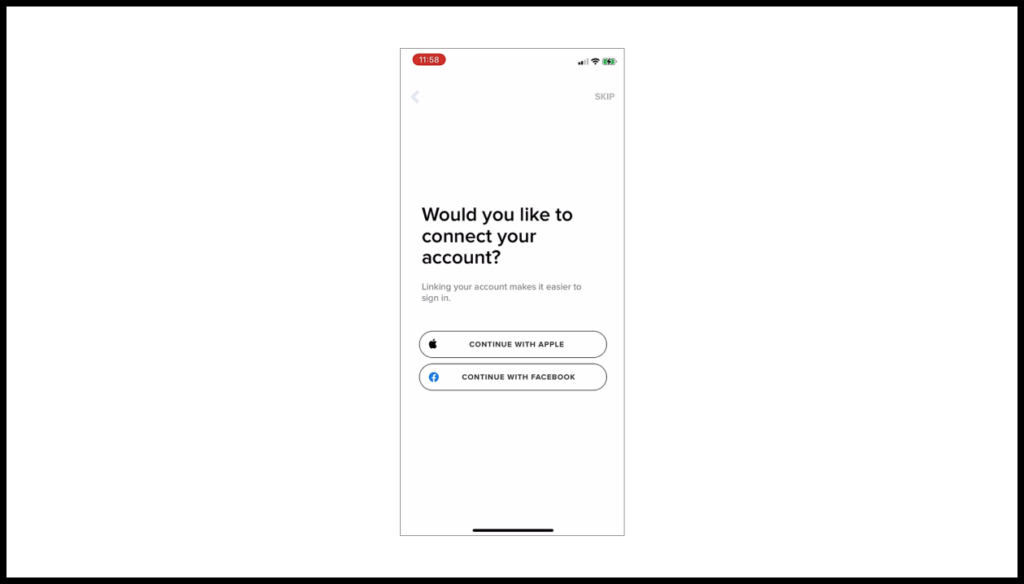
–5 points.
Harry isn’t sure it’s safe to connect a dating app to his other accounts. He’s also afraid that Facebook will show notifications like “Harry’s now on Tinder!” so he decides not to.
Screen 6. Welcome to Tinder
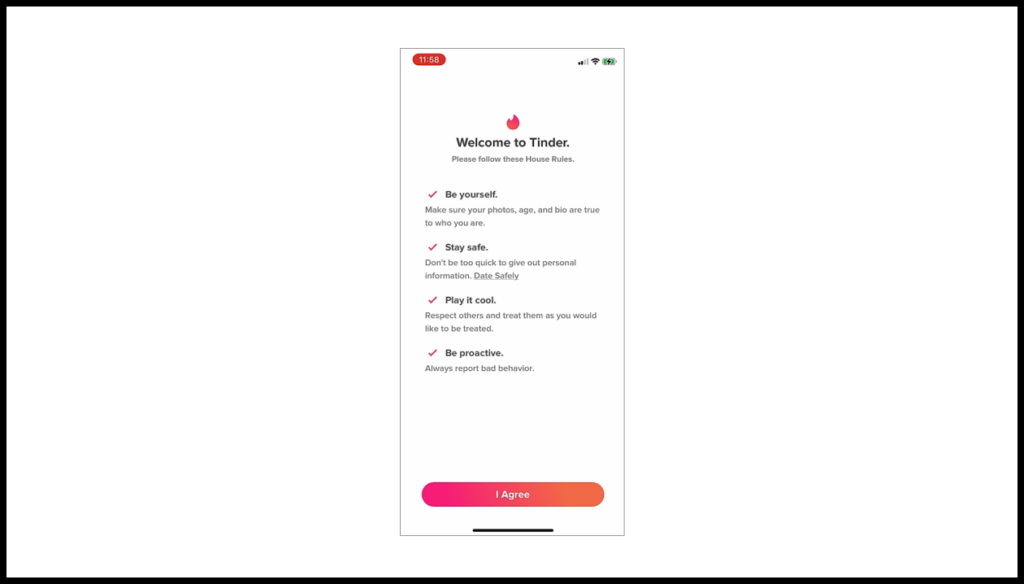
–2 points.
Sign-up screen for reading and agreeing to the Tinder house rules.
+2 points.
Seeing “Welcome to Tinder” and the rules reassures Harry: he’s made progress by successfully signing up.
Screen 7. My first name is
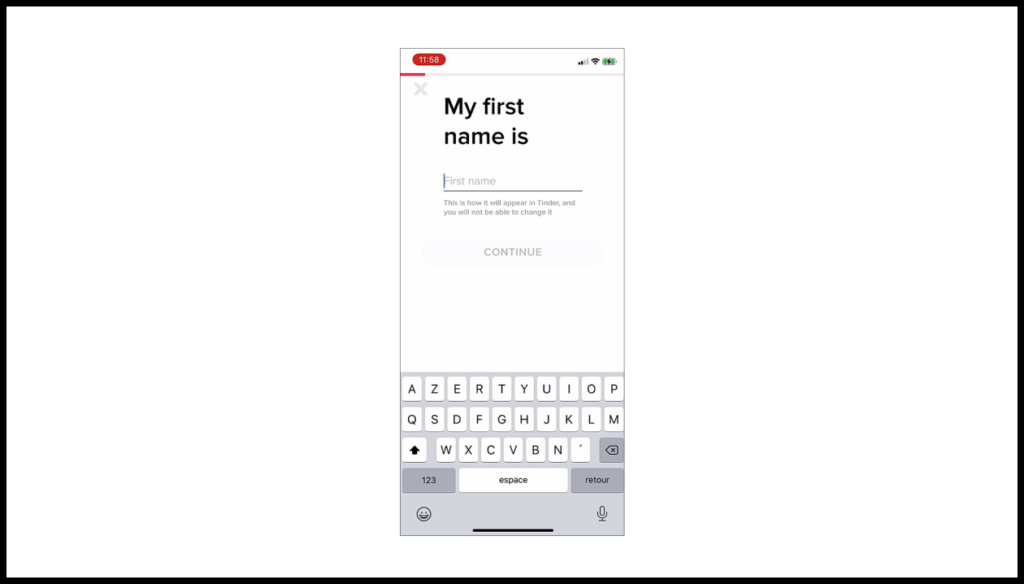
–2 points.
Extra work required so the service can display the user’s profile correctly.
Screen 8. My birthday is
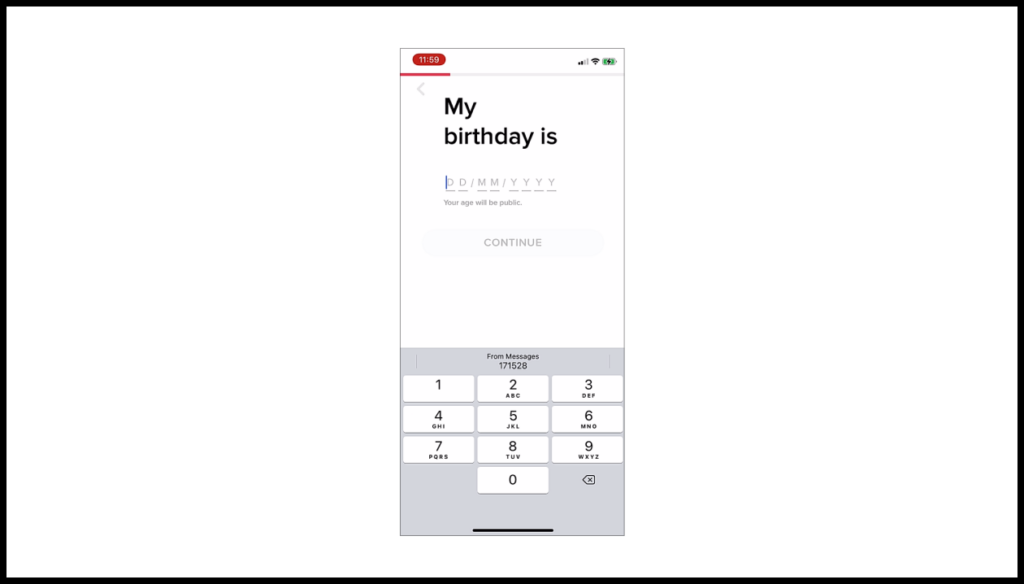
–2 points.
Extra work required so the service can display the user’s profile correctly.
Screen 9. I am a (gender)
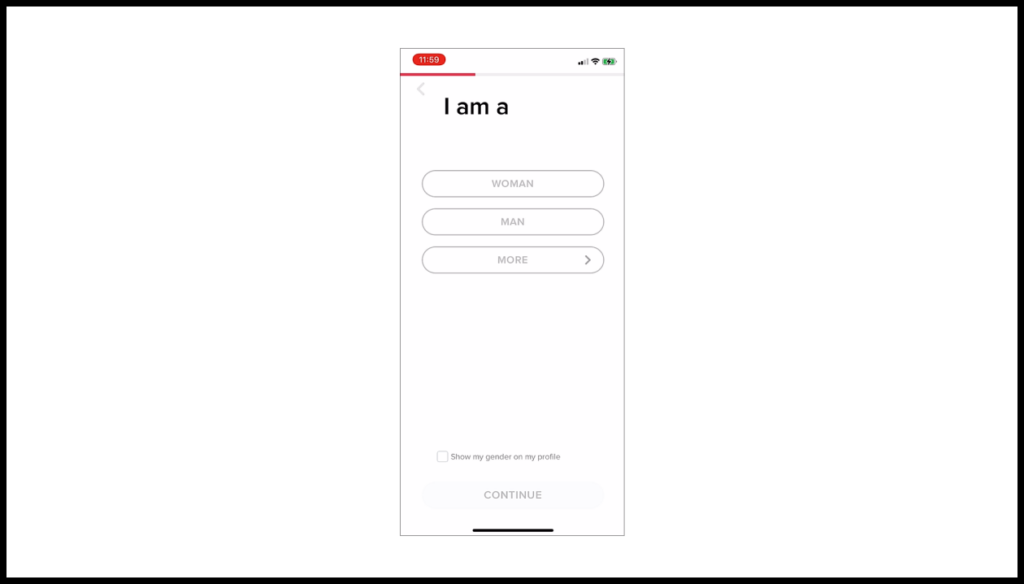
–2 points.
Extra work required so the service can display the user’s profile correctly.
Screen 10. My sexual orientation is
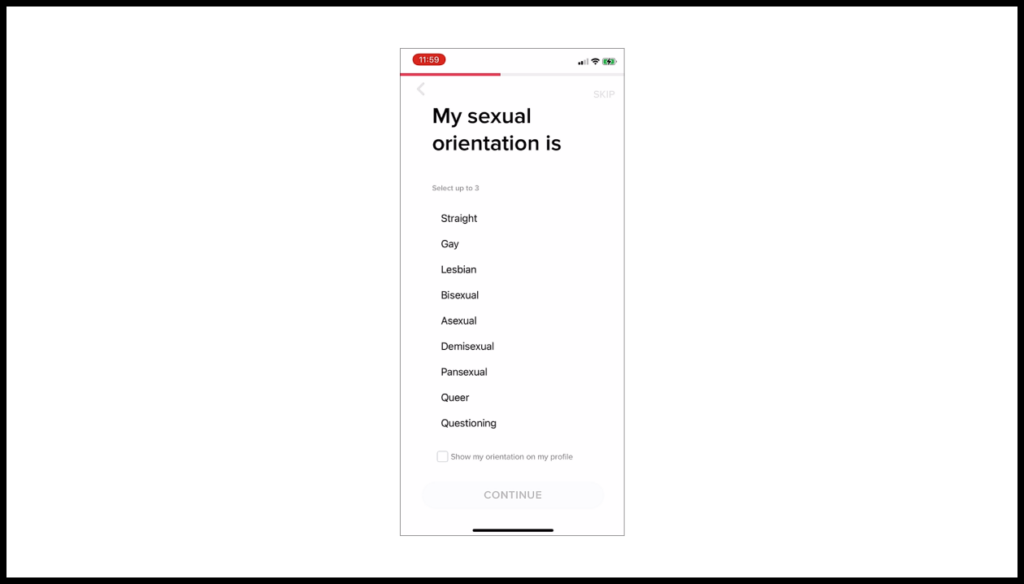
–2 points.
Extra work required so the service can display the user’s profile correctly.
+5 points.
This step implies the product’s purpose, reassuring Harry that the product will help him accomplish his JTBD. This kind of question would be out of place in products not related to this JTBD (like a banking app). Therefore, Harry’s motivation increases.
Screen 11. Show me
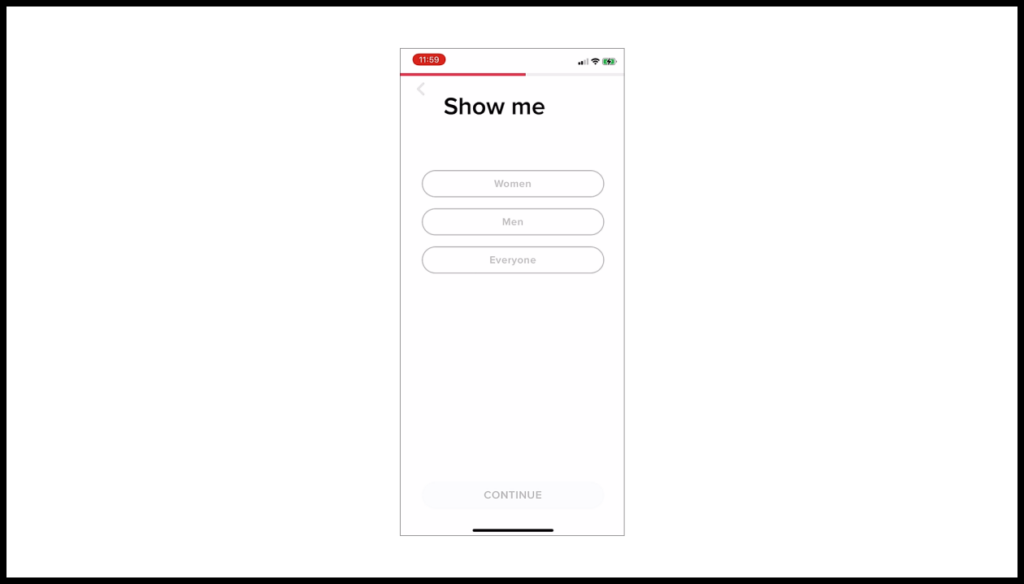
–2 points.
Extra work required so the service can display relevant profiles.
+2 points.
This step elicits Harry’s expectations for the profiles that will soon be presented to him.
Screen 12. My university is
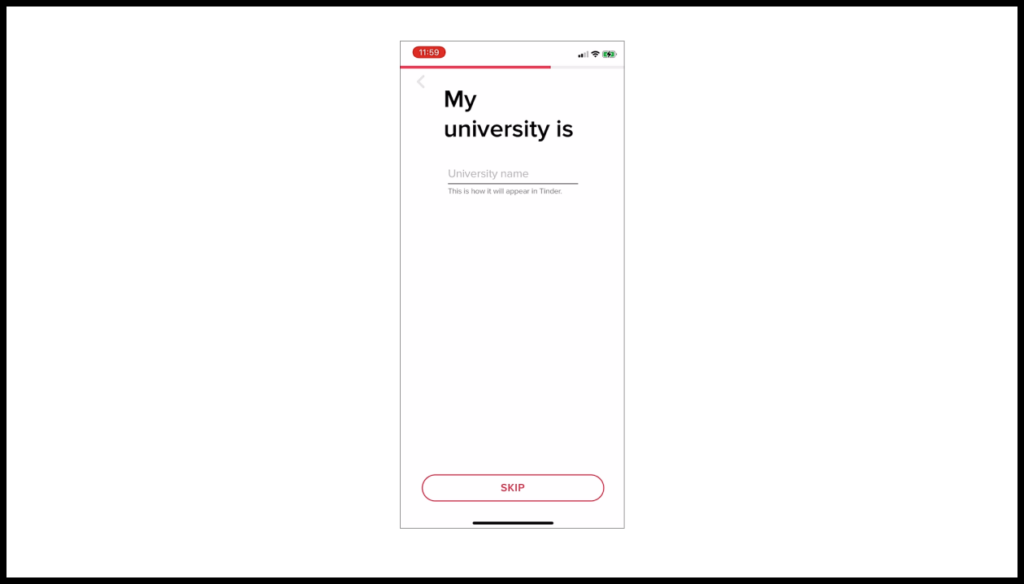
–2 points.
Extra work required so the service can display the user’s profile correctly.
–2 points.
Harry graduated a long time ago. So he doesn’t see why his alma mater should matter for his romantic aspirations.
Screen 13. Passions
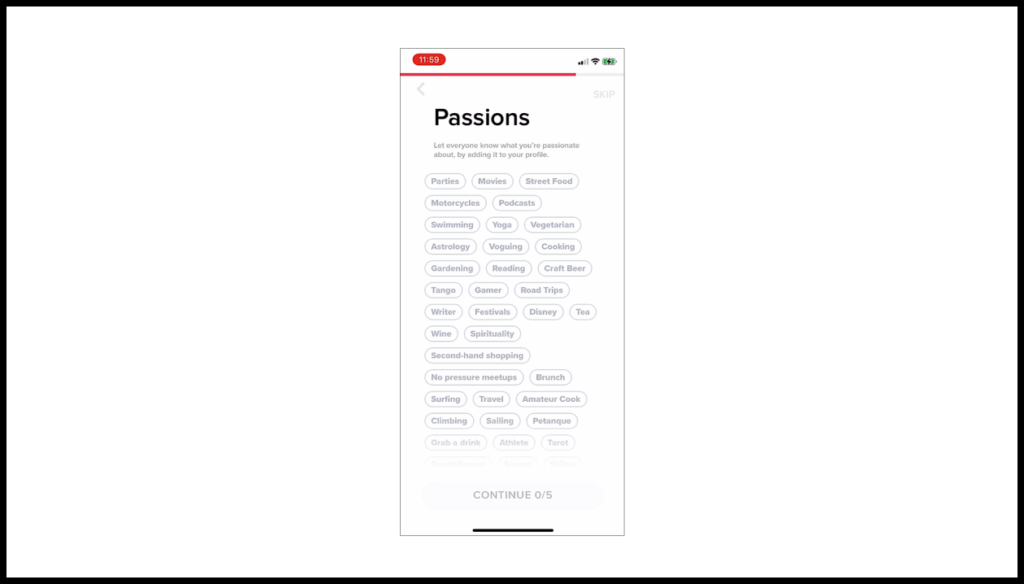
–5 points.
This is a long and complicated step that requires strategizing how to present oneself to potential partners and pick the passions that will create the right impression.
Screen 14. Add photos
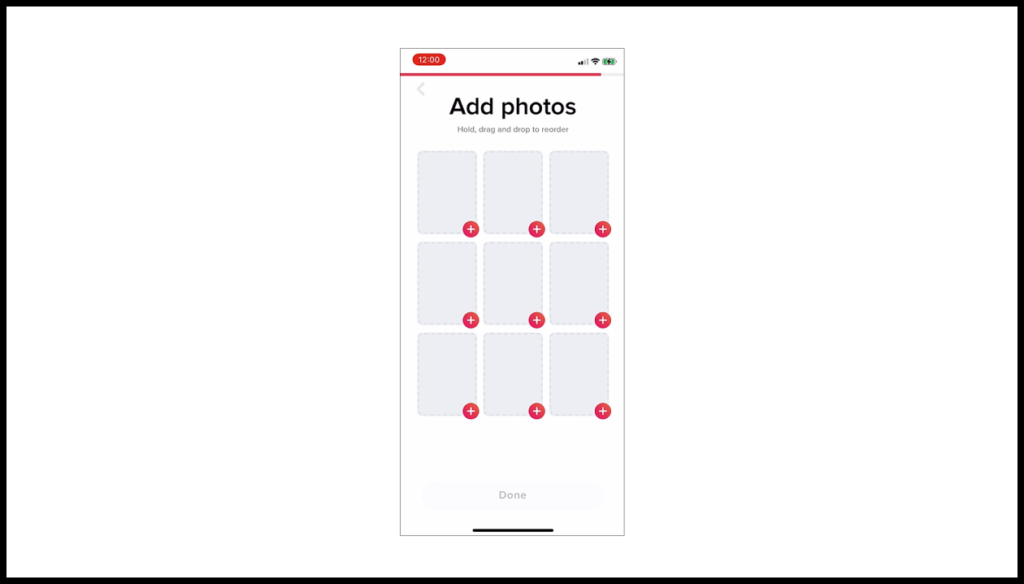
–5 points.
Presenting oneself visually is even more agonizing. Harry hasn’t had any professional photo shoots and doesn’t have many “presentable” photos to share. To complete this step, he has to sort through old photos and take a few fresh selfies.
+10 points.
As he spends time searching for profile-worthy photos, Harry feels like he is getting ready to go on a date. Uploading the photos provides reassurance about his progress so far—he sees how he looks to potential partners on Tinder. This is a nice feeling he hasn’t had for a long time.
Screen 15. Enable location
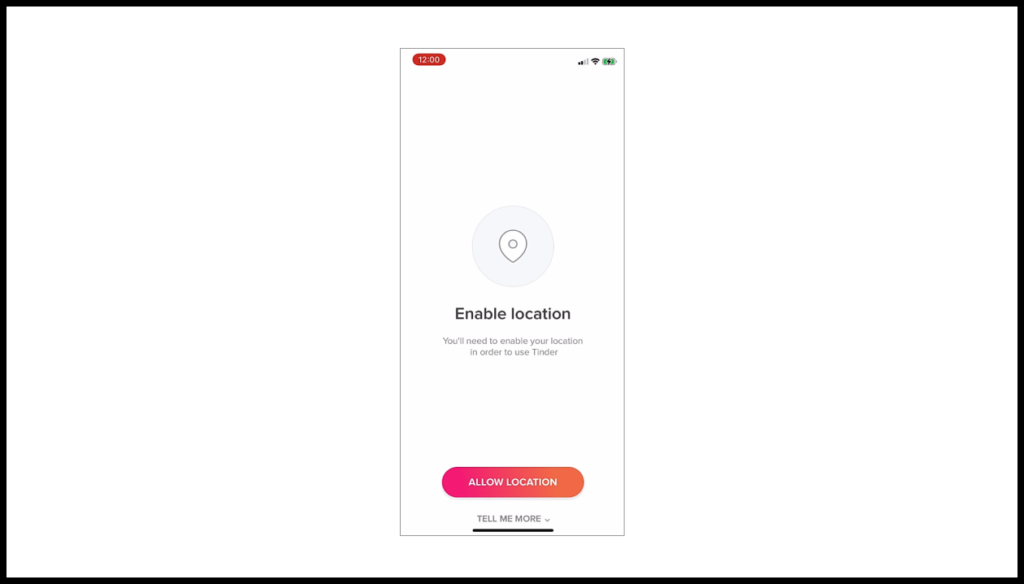
–2 points.
Minor extra work so that Tinder can do its job.
Screen 16. Keep me posted
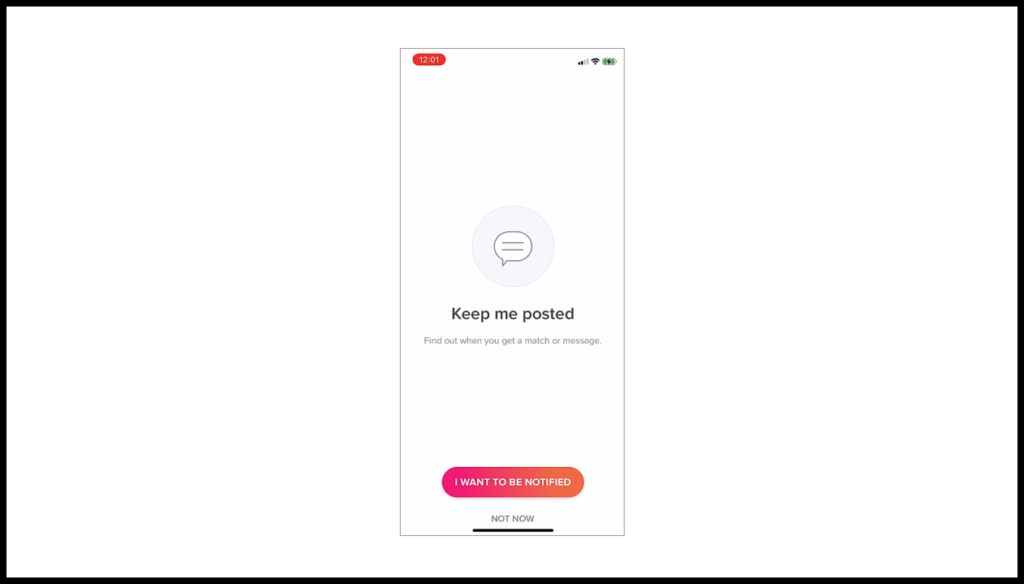
–2 points.
Minor extra work that will help Tinder to be more effective for Harry.
Screen 17. Let’s get you ready!
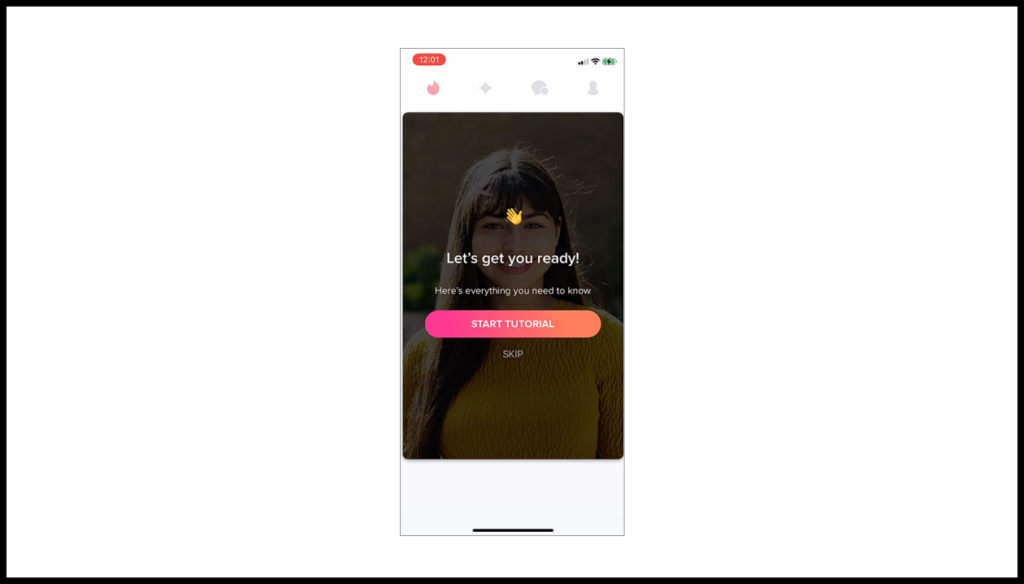
–2 points.
Harry has signed up and filled out his profile, but with no payoff yet. He decides to view the app tutorial although his friends have already told him how to use it.
+5 points.
The background photo shows a real person who Harry finds attractive. This increases his motivation.
Screen 18. Slide right to like
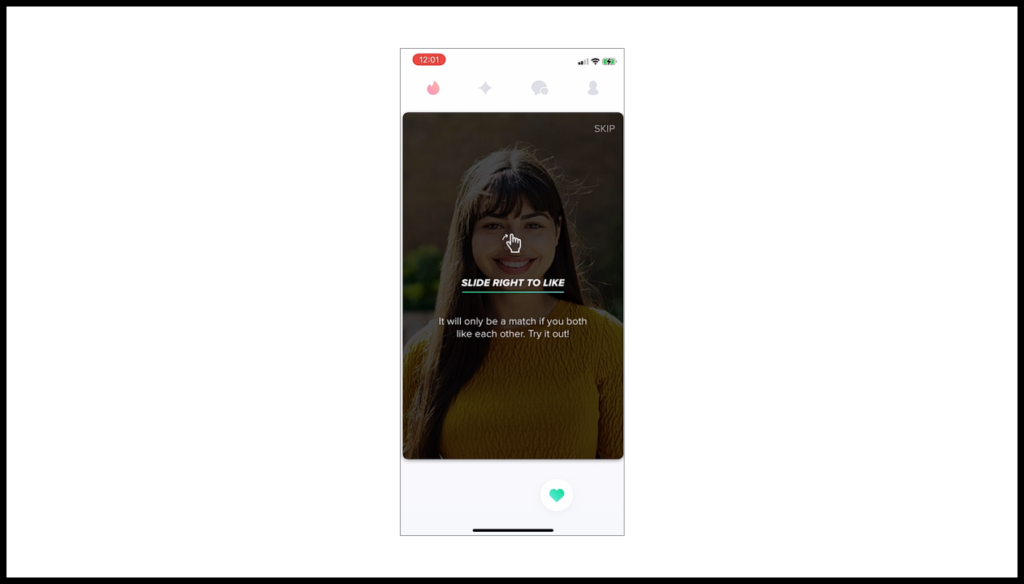
–2 points.
The tutorial screen is asking for extra work.
+2 points.
After swiping right, Harry experiences for the first time how simple and convenient the interface is. This boosts his motivation to stay with the product.
Screen 19. Slide left to pass
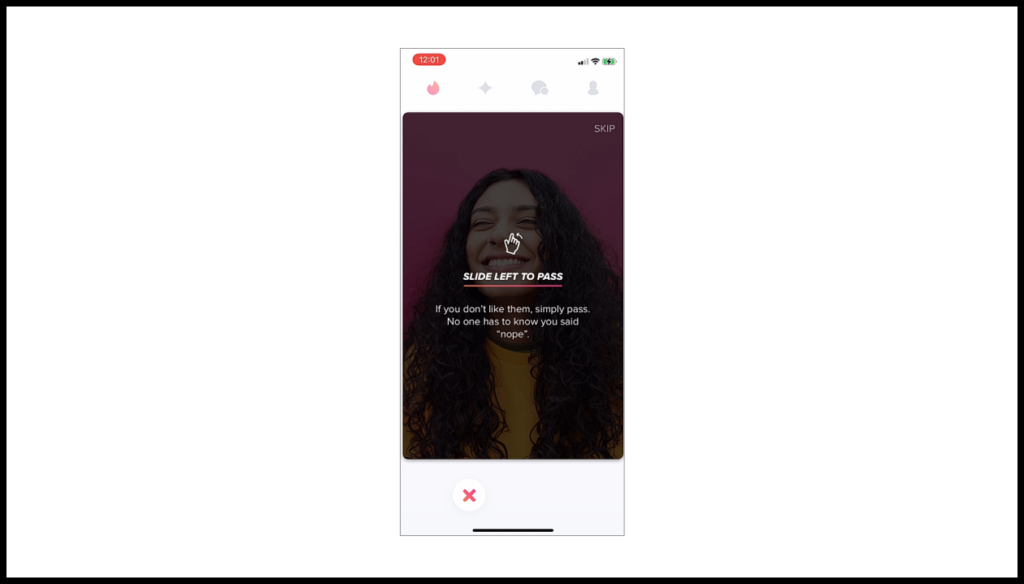
–2 points.
The tutorial screen is asking for extra work.
Screen 20. There’s even more…
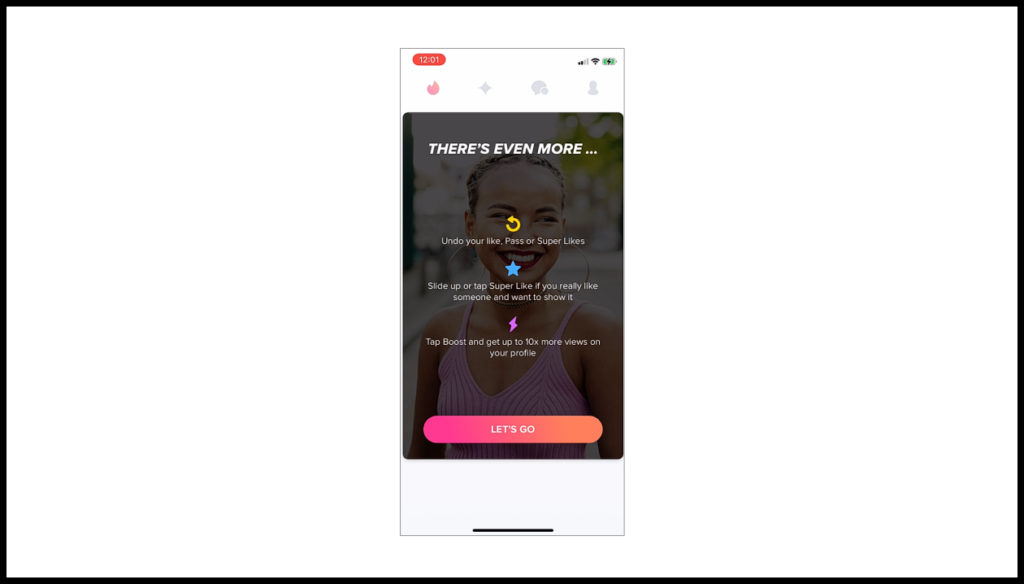
–2 points.
The tutorial screen is asking for extra work.
+5 points.
Learning about superlikes and boosts gives Harry extra confidence that he’ll be able to stand out if he feels the need to.
After completing these steps, Harry finally sees the first profile of a potential match. Now he can truly start using the product.
Even though Harry has finished onboarding, activation won’t be complete until he reaches an “aha moment”.
For the sake of this example, let’s define the “aha moment” as scheduling a first date. This is the moment when Harry feels and appreciates the product’s value for himself.
Post-onboarding, the CJM branches in different directions. Some users will almost immediately get a match and schedule a date. Others will have to go through a lot of swipes, matches, and chats first. So, depending on which scenario is true for a given user, it’s fair to say that motivation graphs will diverge too.
Because these two scenarios overlap extensively and we don’t want to duplicate work, let’s try to use Harry to represent an “average” experience for people in his demographic and base the subsequent parts of this particular CJM around that experience. We’ve performed session analysis of app users and know that after onboarding, user activity will take place in certain stages.
A. Swiping: Round 1
+10 points.
Harry starts viewing profiles. His motivation grows because he sees lots of attractive faces.
B. Swiping: Round 2
–5 points.
Eventually, Harry gets tired of this. He starts speed-swiping and barely even looks at each profile.
C. Waiting for a reply
–10 points.
A few hours later, Harry still hasn’t gotten any matches (in other words, none of the people he liked have liked him back).
He starts wondering whether he did a good job with his profile, whether he picked the right photos, and whether he’s even attractive to anyone at all. Then he starts making a few improvements to his profile.
D. First match and chat
+10 points.
The next morning, Harry sees an app notification: he’s gotten his first match. This increases his motivation.
–2 points.
For a while Harry is at a loss for how to start a conversation. But then he thinks of a good opener.
+10 points.
First chat! Harry is thrilled to get this far after so little time on Tinder.
–5 points.
After talking, Harry realizes that a date is not in the cards here.
E. Swiping: Round 3
+10 points.
Harry keeps browsing profiles and sees a few more attractive women who spark his interest.
F. Second match—and a date
+10 points.
Harry is notified about a new match.
+10 points.
Harry sees that someone has liked him back. Even better, this is one of the women he found most intriguing.
+10 points.
She writes first! Harry’s motivation gets a major boost, since he wasn’t confident in his ability to start a conversation.
+10 points.
The two of them have a fun, light-hearted conversation. Harry is in a much better mood.
+10 points.
They decide to meet that evening. Harry has experienced Tinder’s value for himself. He has scheduled a date just a day after signing up. Before this, he hadn’t been able to find a good way to meet and invite women on dates.
Step 4. Calculate the net impact of each step on user motivation
Here is a table showing how motivation fluctuated over time. We’ve calculated the total impact of each step on Harry’s level of motivation.
| Start | App Store | 1 | 2 | 3 | 4 | 5 | 6 | 7 | 8 | 9 | 10 | 11 | 12 | 13 | 14 | 15 | 16 | 17 | 18 | 19 | 20 | A | B | C | D | E | F |
| Net impact of step | |||||||||||||||||||||||||||
| 0 | -2 | -2 | -2 | -2 | -2 | -5 | 0 | -2 | -2 | -2 | +3 | 0 | -4 | -5 | +5 | -2 | -2 | +3 | 0 | -2 | +3 | +10 | -5 | -10 | +13 | +10 | +50 |
| Motivation remaining | |||||||||||||||||||||||||||
| 80 | 78 | 76 | 74 | 72 | 70 | 65 | 65 | 63 | 61 | 59 | 62 | 62 | 58 | 53 | 58 | 56 | 54 | 59 | 59 | 57 | 60 | 70 | 65 | 55 | 68 | 78 | 128 |
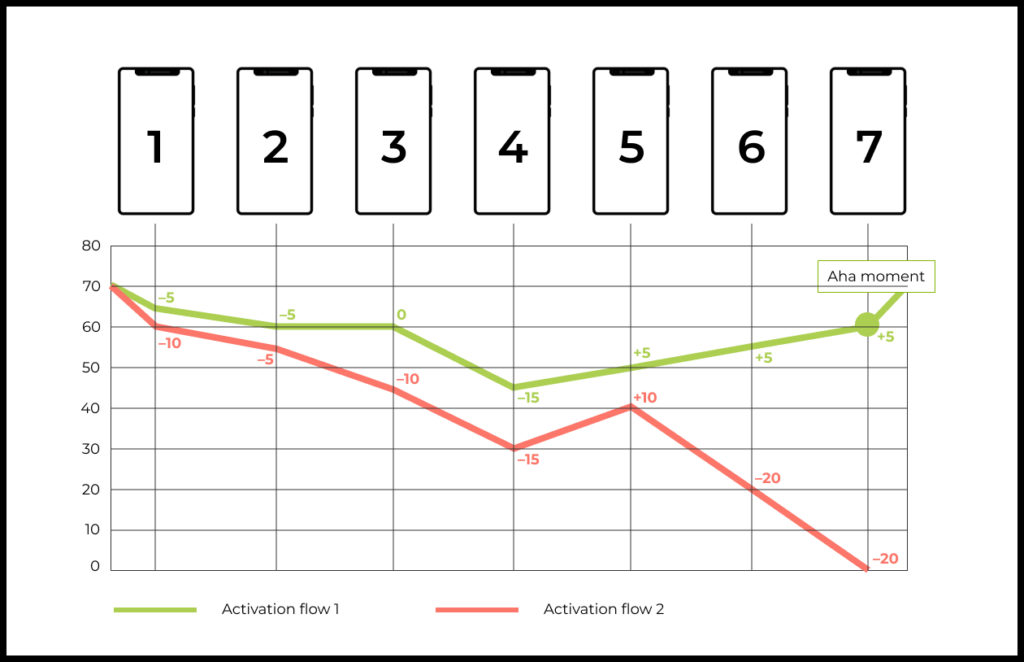
Step 5. Make a graph of how motivation fluctuates as the user proceeds from learning about the product to reaching an “aha moment”
The motivation graph shows that Harry reached an “aha moment” and became a successful Tinder user even though activation took time and his motivation occasionally dropped.
But imagine if Harry had downloaded the app with much lower initial motivation or if it took 10 days for him to get his first match. In those cases, low initial motivation or very long time to value could have driven Harry’s motivation below zero.
If either of those things had happened, Harry would have given up on the app without having solved his JTBD. We would not have activated a potential client.
Tax/benefit template
You can use any software you prefer for this analysis. For collaboration, our suggestions include Miro or FigJam. Google Sheets is also an option.
Here is a sample template in Google Sheets. Feel free to use it.
Mechanisms for making activation more effective based on tax/benefit analysis
Applying the tax/benefit framework to the activation flow is useful because, if done thoughtfully, it pushes the team to suggest ways for improving activation.
Most of these ideas will belong to one of four categories:
- Encouraging the level of motivation necessary for new users to reach value.
- Eliminating tax steps, or turning them into benefit steps.
- Reordering activation steps.
- Locally optimizing specific activation steps.
Let’s discuss each of these categories.
Encouraging the level of motivation necessary for new users to reach value
A product’s degree of complexity and time to value will dictate how much initial motivation is necessary for a user to reach value and succeed with the product.
The graph and scores for activation steps, as described above, tell us how motivated new users have to be in order to reach an “aha moment”.
And that information indicates which acquisition mechanisms are available to the team and which mechanisms could help to increase that motivation.
For example, you might find that typical Facebook ads won’t work for your product, and that instead you should use content and retarget the users who read your content all the way through. This is just one possible example of how to purposefully select for the users who, before they ever sign up, have enough motivation and trust to ultimately succeed.
Eliminating tax steps, or turning them into benefit steps
The framework offers the team a new vantage point that makes them reevaluate the product experience from the perspective of the user. In the process of this analysis, teams often find that instead of providing value, they have been exhausting users by asking them to perform many different actions.
The most obvious way to solve this problem is to get rid of tax steps. But this isn’t always possible. By the time you start working on activation, any easy wins have probably long ago been achieved.
And of course, almost every activation flow has to have tax steps that prompt the user to provide data, make a choice, accept terms and conditions, etc. No matter how hard we might wish, at least some of these steps are simply unavoidable.
One of the purposes of the framework is to calculate how much initial motivation the user is prepared to “spend”. Since it’s impossible to eliminate all tax steps, the user will have to spend some portion of their motivation no matter what. But you should try to minimize the number of these tax steps and balance them out with benefit steps. The result should be that the user finishes activation with the same amount of motivation as they had before, or ideally, even more.
Here is an example of how this balancing could work in practice. Imagine that you offer SEO analytics for websites. During the activation flow for your product, you ask the user to provide information about their site and search requests.
In your current flow, you ask for information without giving anything in return. This makes this step a tax. The benefit will come only a day later, when you send the user a report. The time to value is more than 24 hours. During that time, many users will quickly forget about your service or select a competitor.
By contrast, imagine that immediately after you request the data you need, you give the user a summary about their site traffic, search requests, and competitors. This balances out the tax step (asking for data) with a benefit step (one that demonstrates the product’s value).
Reordering activation steps
Imagine that you’ve come to a gym for your first workout. Your personal trainer has made a workout plan: you do 10 exercises, with 10 rest breaks. But you get to decide how to arrange your workout:
- Either do all 10 exercises in a row and then take all 10 rest breaks…
- …or take a rest break after each exercise.
How you feel afterwards will change a lot depending on which option you choose.
The order and progression of levels is critical in game design, too. Levels are usually designed to alternate between a big challenge and then a chance to relax.
So it’s no surprise that order matters for activation as well. As you design activation for your own product, try to keep user motivation stable and without steep drop-offs. This is why you should try to make up for tax steps with benefit steps that will move the user forward.
Ideally, every tax step would be immediately followed by a benefit step that helps the user to realize why they just spent time and effort, by immediately showing them the beneficial effect of that investment.
Sometimes it’s possible to stack value at the beginning of the funnel. This front-loading will help to propel users through any “expensive” tax steps that come later.
For example, Similarweb gives users free basic analytics for any website without even requiring sign-up, which acts as a strong benefit step at the start of the activation funnel.

Locally optimizing specific activation steps
We’ve discussed this method previously. At its core, it means looking at each step of the flow in terms of reducing friction and strengthening user motivation.