This is part of a series of articles on activation and making sure users experience and appreciate your product’s value.
Here we will discuss how to spot the “aha moment” by combining qualitative and quantitative methods.
→ Test your product management and data skills with this free Growth Skills Assessment Test.
→ Learn data-driven product management in Simulator by GoPractice.
→ Learn growth and realize the maximum potential of your product in Product Growth Simulator.
→ Learn to apply generative AI to create products and automate processes in Generative AI for Product Managers – Mini Simulator.
→ Learn AI/ML through practice by completing four projects around the most common AI problems in AI/ML Simulator for Product Managers.
All posts from the series
01. When user activation matters and you should focus on it.
02. User activation is one of the key levers for product growth.
03. The dos and don’ts of measuring activation.
04. How “aha moment” and the path to it change depending on the use case.
05. How to find “aha moment”: a qualitative plus quantitative approach.
06. How to determine the conditions necessary for the “aha moment”.
07. Time to value: an important lever for user activation growth.
08. How time to value and product complexity shape user activation.
09. Product-level building blocks for designing activation.
10. When and why to add people to the user activation process.
11. Session analysis: an important tool for designing activation.
12. CJM: from first encounter to the “aha moment”.
13. Designing activation in reverse: value first, acquisition channels last.
14. User activation starts long before sign-up.
15. Value windows: finding when users are ready to benefit from your product.
16. Why objective vs. perceived product value matters for activation.
17. Testing user activation fit for diverse use cases.
18. When to invest in optimizing user onboarding and activation.
19. Optimize user activation by reducing friction and strengthening motivation.
20. Reducing friction, strengthening user motivation: onboarding scenarios and solutions.
21. How to improve user activation by obtaining and leveraging additional user data.
Last time we described the key steps to help users realize the added value of your product. These steps will vary for each use case, based on what the user is trying to accomplish with the product.
So how do we go about searching for a product’s “aha moment”?
Мisconceptions about the “aha moment”
A very common mistake when looking for an “aha moment” is to jump into quantitative analysis right away. It can be tempting to start calculating the correlation between different actions and long-term user success or measure retention rates among cohorts of users who have performed different actions. But there are two big reasons not to skip qualitative methods:
- First, different use cases can have different aha moments and ways of reaching them. Quantitative-only methods will overlook these entirely.
- Second, if you look only at metrics, you lose a lot of important information. You fail to get the user context, alternatives available to the user, or added value. Without this information you probably won’t be able to understand the user’s motivation or create mechanisms for surfacing value.
A better approach, then, is to spot potential “aha moments” with qualitative methods and fine-tune them with quantitative methods. We will be demonstrating how this approach can identify an “aha moment” specific to a particular use case.
Starting the search for the “aha moment” with qualitative methods
Here are a few starter questions for thinking where your aha moments might be:
- For what “job” (in the JTBD sense of the word) does your product have a strong product/market fit?
- What alternatives are currently available for accomplishing that “job”?
- How does your product create added value compared to each of those alternatives?
By far the best way of answering these questions is to hold in-depth JTBD interviews with users who see the value of your product and use it regularly. These users are the litmus test of value.
For example, the added value of Zoom might be high connection quality compared to the alternatives. So one potential “aha moment” might be a group call where nobody had any technical glitches.
Pinterest might add value when a user selecting home décor ideas gets higher-quality recommendations compared to Google search results and interior design magazines. When a user creates a board with ten pins related to home décor, that could very well be an “aha moment”.
In the case of Workplace from Meta, a platform for company-wide communication, successful users from major companies were consistent in their feedback. They were excited that in just one week of using Workplace, they learned much, much more about their company and colleagues than they had ever learned previously. Despite the collaborative culture of the tech industry, there are still plenty of companies where employees are siloed off with no visibility into goings-on at the company level. So for this Workplace use case, one “aha moment” might be viewing ten posts from colleagues in one’s feed or interacting with content (posts, comments, messages, or likes) ten times.
At this point you don’t need to precisely define the “aha moment” yet. The goal is just to keep a few “possibles” in mind. They are each defined in terms of specific actions that are highly likely to reflect your product’s added value to users.
If you’re feeling stuck, try the following quick exercise:
- Think of a few products that you use every day.
- Try to remember what you used before those products.
- Figure out why you chose a new way to accomplish that particular “job”. At what point did you realize that the new way is better than the old one?
Taking a minute to think about your personal experience with products can be very helpful for seeing the relationship between added value and the actions that help to realize it.
Identifying the “aha moment” with quantitative methods
We started by using qualitative methods to narrow down “aha moments” to a few promising candidates in the context of a specific use case. Now we bring in quantitative methods to pinpoint the best “aha moment” and appropriate metric.
Among the potential “aha moments”, we want to find the one that is most likely to lead to user success in the context of the use case. We should make sure of three things:
- Users who perform the given action are highly likely to become successful. They continue using the product regularly.
- Users who do not perform the action are highly likely to not become successful. They do not continue using the product regularly.
- There is a cause-and-effect relationship between the user action and user success.
What the metric for the “aha moment” looks like
To describe the “aha moment”, the metric will be some variation of:
“The user performed X actions within Y days after signup.”
We’ve just come up with a few actions that might lead to an “aha moment”, based on the qualitative analysis above.
But how long should Y be? This will depend on the product type and use case. For a daily use case, one or a few days after signup should be enough. For workplace products, we probably want one (or a few) weeks, based on the length of the standard work cycle. But for travel services, our timescale might be months.
The reason for the time cut-off is that new users don’t have infinite motivation. If they have signed up but still not figured out how the product benefits them, over time the chances of them becoming successful approach zero.
Back to our Workplace example, let’s consider a few possible “aha moments” at a traditional large company:
- With qualitative research, we determined that users at large companies discovered added value by learning more about their company in Workplace in just days than they had ever known previously.
- The user learns something interesting about their company when they receive high-quality content. So our target action might be the user viewing posts in their feed.
- Perhaps we aren’t sure that all that content is actually relevant to the user. We can try to compensate by measuring content-related user interactions (such as posting, commenting, sending or receiving messages, or liking a post). We don’t know which of these actions reveals value best of all. Finding out will come in the next step.
- We count only activity during the first week (7 days) after signup since the product is for workplace users.
So for the Workplace use case at a large old-fashioned company, we have hypothesized two potential “aha moments” for the end user:
- User has viewed X posts in 7 days.
- User has interacted with content (by posting, commenting, sending or receiving a message, or liking a post) X times in 7 days.
In a real-life situation, we probably would have created a few more possible “aha moments” to test. One way is to change the cut-off (instead of 7 days, we could use 1 day or 14 days). We could also consider other actions that surface value to the user, such as viewing posts from close colleagues or corporate management.
But for illustration purposes, we’ll stick with just these two “aha moments” to compare against each other.
Correlation analysis of potential “aha moments”
After finding some potential “aha moments” in the previous step, we want to know the optimal number of actions for each of them.
We define a criterion for long-term success in the context of the use case. For each potential “aha moment”, we want to answer the following two questions:
- How well does the “aha moment” correlate with long-term user success?
- Conversely, how well does the absence of the “aha moment” correlate with the user not becoming successful?
Ideally, we want an action that leads to success of the maximum possible number of users performing it. And when the action isn’t performed, this should lead to dropout (not becoming successful) by the maximum possible number of users.
Workplace “aha moments”: correlation analysis
Let’s take one of the possible aha moments for Workplace: “User has viewed X posts in 7 days.”
For our user success criterion, we will use whether the user returns at Week 4 post-signup. This is the point where the retention curve for Workplace users flattens out.
So we take the subset of new users who signed up for the product more than four weeks ago. We need to be able to determine whether a particular user became successful—in this case, whether or not they were active at Week 4.
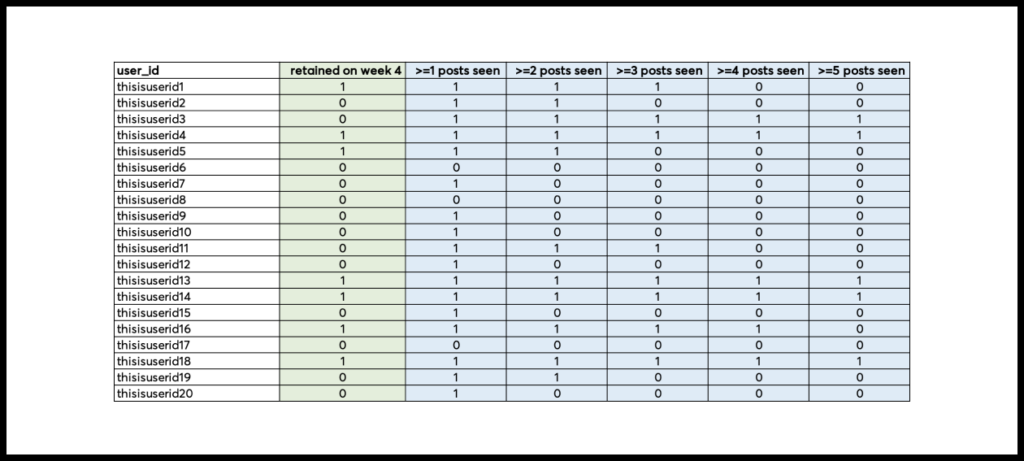
Then we obtain the following information for each user in the cohort:
- Did the user become successful (are they active at Week 4)?
- Did the user view 1 or more posts in the first 7 days?
- Did the user view 2 or more posts in the first 7 days?
- …
- Did the user view 30 or more posts in the first 7 days?

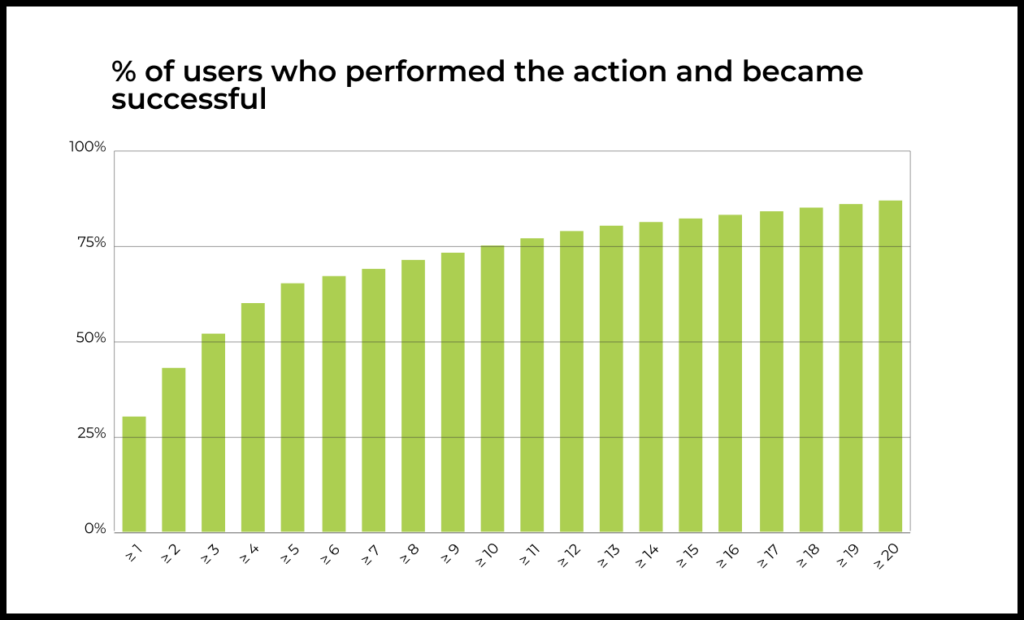
We cross-reference this dataset with each of the actions and calculate the success rate:
- Among users who viewed 1 or more posts in the first 7 days, what percentage of them became successful?
- Among users who viewed 2 or more posts in the first 7 days, what percentage of them became successful?
- …
- Among users who viewed 30 or more posts in the first 7 days, what percentage of them became successful?

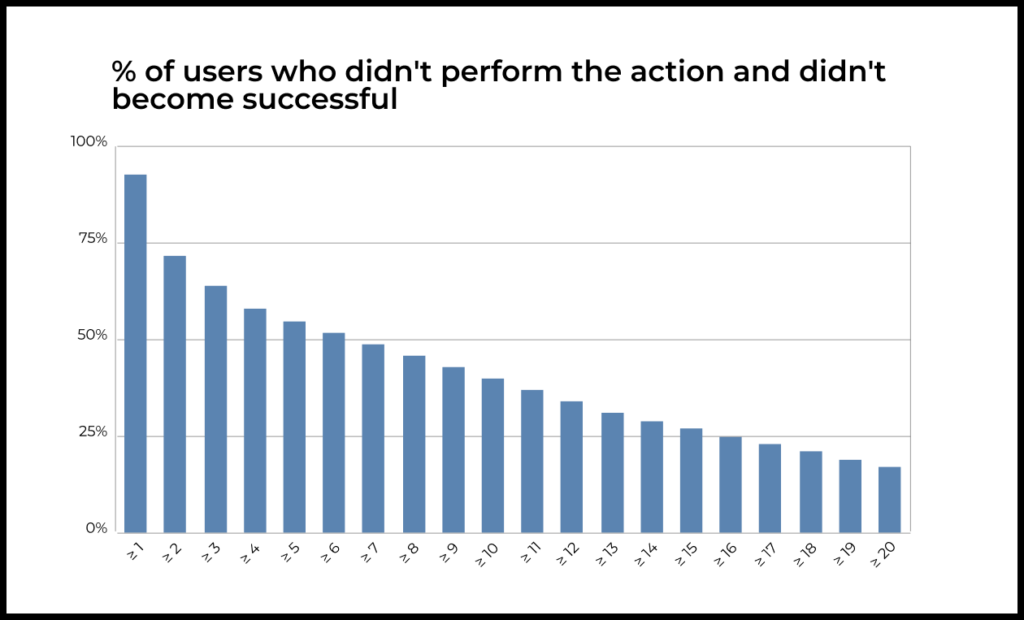
We also want to know what percentage of users who did not perform the action subsequently did not see the product’s value and did not become successful:
- Among users who did not view 1 or more posts in the first 7 days, what percentage of them did not become successful?
- Among users who did not view 2 or more posts in the first 7 days, what percentage of them did not become successful;
- …
Among users who did not view 30 or more posts in the first 7 days, what percentage of them did not become successful?

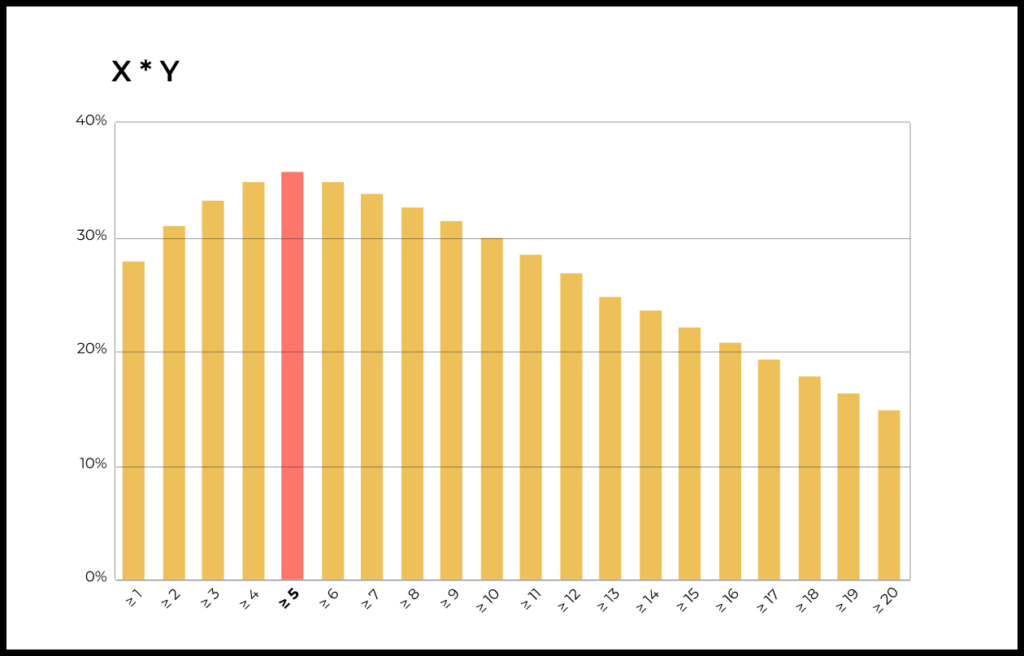
Now we want to select the value for the “aha moment” maximizing both of these metrics. The optimal maximization methods can vary and are highly case-specific.
Usually, we find the point where the first curve flattens out and then select the nearby value that maximizes the second curve.
Or, to put it more rigorously, we multiply the two metrics (rates) and select the value that maximizes the result.
Here for our “aha moment” we’ll select 5 or more views in the first 7 days after signup. This criterion does a decent job of predicting user success: 65% of these users are still active at Week 4. Predictive power is slightly worse for dropout among those who didn’t perform the action, at just 55%.

Fine-tuning the “aha moment”
Correlation analysis gave us a potential “aha moment” for each of the actions. Now we just need to find which one fits the data best.
Let’s say we got the following numbers:
“User viewed 5 posts in the first 7 days after signup”:
- 65% success rate for users who performed this action
- 55% dropout rate for users who did not perform this action
“User interacted with content 7 times in the first 7 days after signup”:
- 85% success rate for users who performed this action
- 75% dropout rate for users who did not perform this action
As the success and dropout rates each approach 100%, the better the given action articulates value to the user.
The second action (“User interacted with content 7 times in the first 7 days after signup”) wins, since it better describes both the success rate and dropout rate.
If the winner is not so clear-cut, you will have to make a judgment call based on which rate you believe to be more important and your qualitative understanding of which one better demonstrates added value.
Experimentally validating cause-and-effect between the “aha moment” and success
We’ve just used correlation analysis to define potential “aha moments” and pick the one with the best predictive power. But correlation between an action and long-term user success does not equal causation.
That’s why for the last step, we need to show that there is, in fact, a cause-and-effect relationship between the action and user success (that as a result of the action, the user sees added value and continues to use the product).
The only way to be sure is with an experiment. This means a different percentage of users in a test group should experience the “aha moment” compared to users in the control group. If user success rates change as a result of the experiment, you have successfully found a cause-and-effect relationship. A/B testing is frequently used in practice for this purpose.
The closer that the success rate and dropout rate get to 100%, the more likely it is that your “aha moment” really does have a causal relationship to long-term success.
Finding the “aha moment”: from start to finish
Let’s quickly recap all the steps we have just gone through.
The “aha moment” depends on what the user is trying to accomplish with the product. So when defining an “aha moment”, we always do so in the context of a specific use case.
Start with qualitative methods for finding an “aha moment”. Brainstorm a few possible aha moments by asking:
- For what “job” (in the JTBD sense of the word) does your product have a strong product/market fit?
- What alternatives are currently available for accomplishing that “job”?
- How does your product create added value compared to each of those alternatives?
These answers will suggest user actions in the product that may lead to the user realizing the product’s added value and deciding to switch to your product (activation).
The next step is to apply quantitative methods.
A possible “aha moment” can often be defined in the following form: “The user performed X actions within Y days after signup.”
For each such action, we calculate the optimal number based on correlation analysis.
We then pick the “aha moment” that maximizes the following two values:
- Success rate (users who perform the action and continue to use the product)
- Dropout rate (users who do not perform the action and do not continue to use the product)
The final step is to validate a cause-and-effect relationship between the “aha moment” and user success. This can be confirmed by changing the percentage of users in a test group who experience the aha moment compared to the percentage of users experiencing it in the control group. If the experiment leads to a change in the user success rate, then we have proven causality.
Conditions making the “aha moment” possible
We measure the success rate based on the percentage of users who have felt added value and continued using the product for a specific “job”. This can be represented by a plateau in the retention curve or by the amount of “work” that the product does for users.
Understanding how product changes impact the user experience requires interim metrics at different points of the value journey. To put together a system of metrics describing user activation, we’ve taken a successful user and worked backwards from there.
- In the previous article, we saw how the path to the “aha moment” will differ by use case. Each of the product’s use cases will need different criteria and metrics.
- Here we went through all the steps for defining an “aha moment” in the context of a particular product use case.
- In an upcoming article, we will discuss how to discover the conditions necessary for the “aha moment” to happen in a particular use case.


